Click on images to enlarge them
Density of continental roots:
Compositional and thermal effects.
Compositional and thermal effects.
how the compositional component of density of the lithospheric roots varies
beneath continents. Our analysis is based on the interpretation of residual
topography and mantle gravity anomalies, calculated by subtracting the
crustal effects from the observed field, and on the upper mantle temperature
variations estimated from heat flow and seismic tomography data.
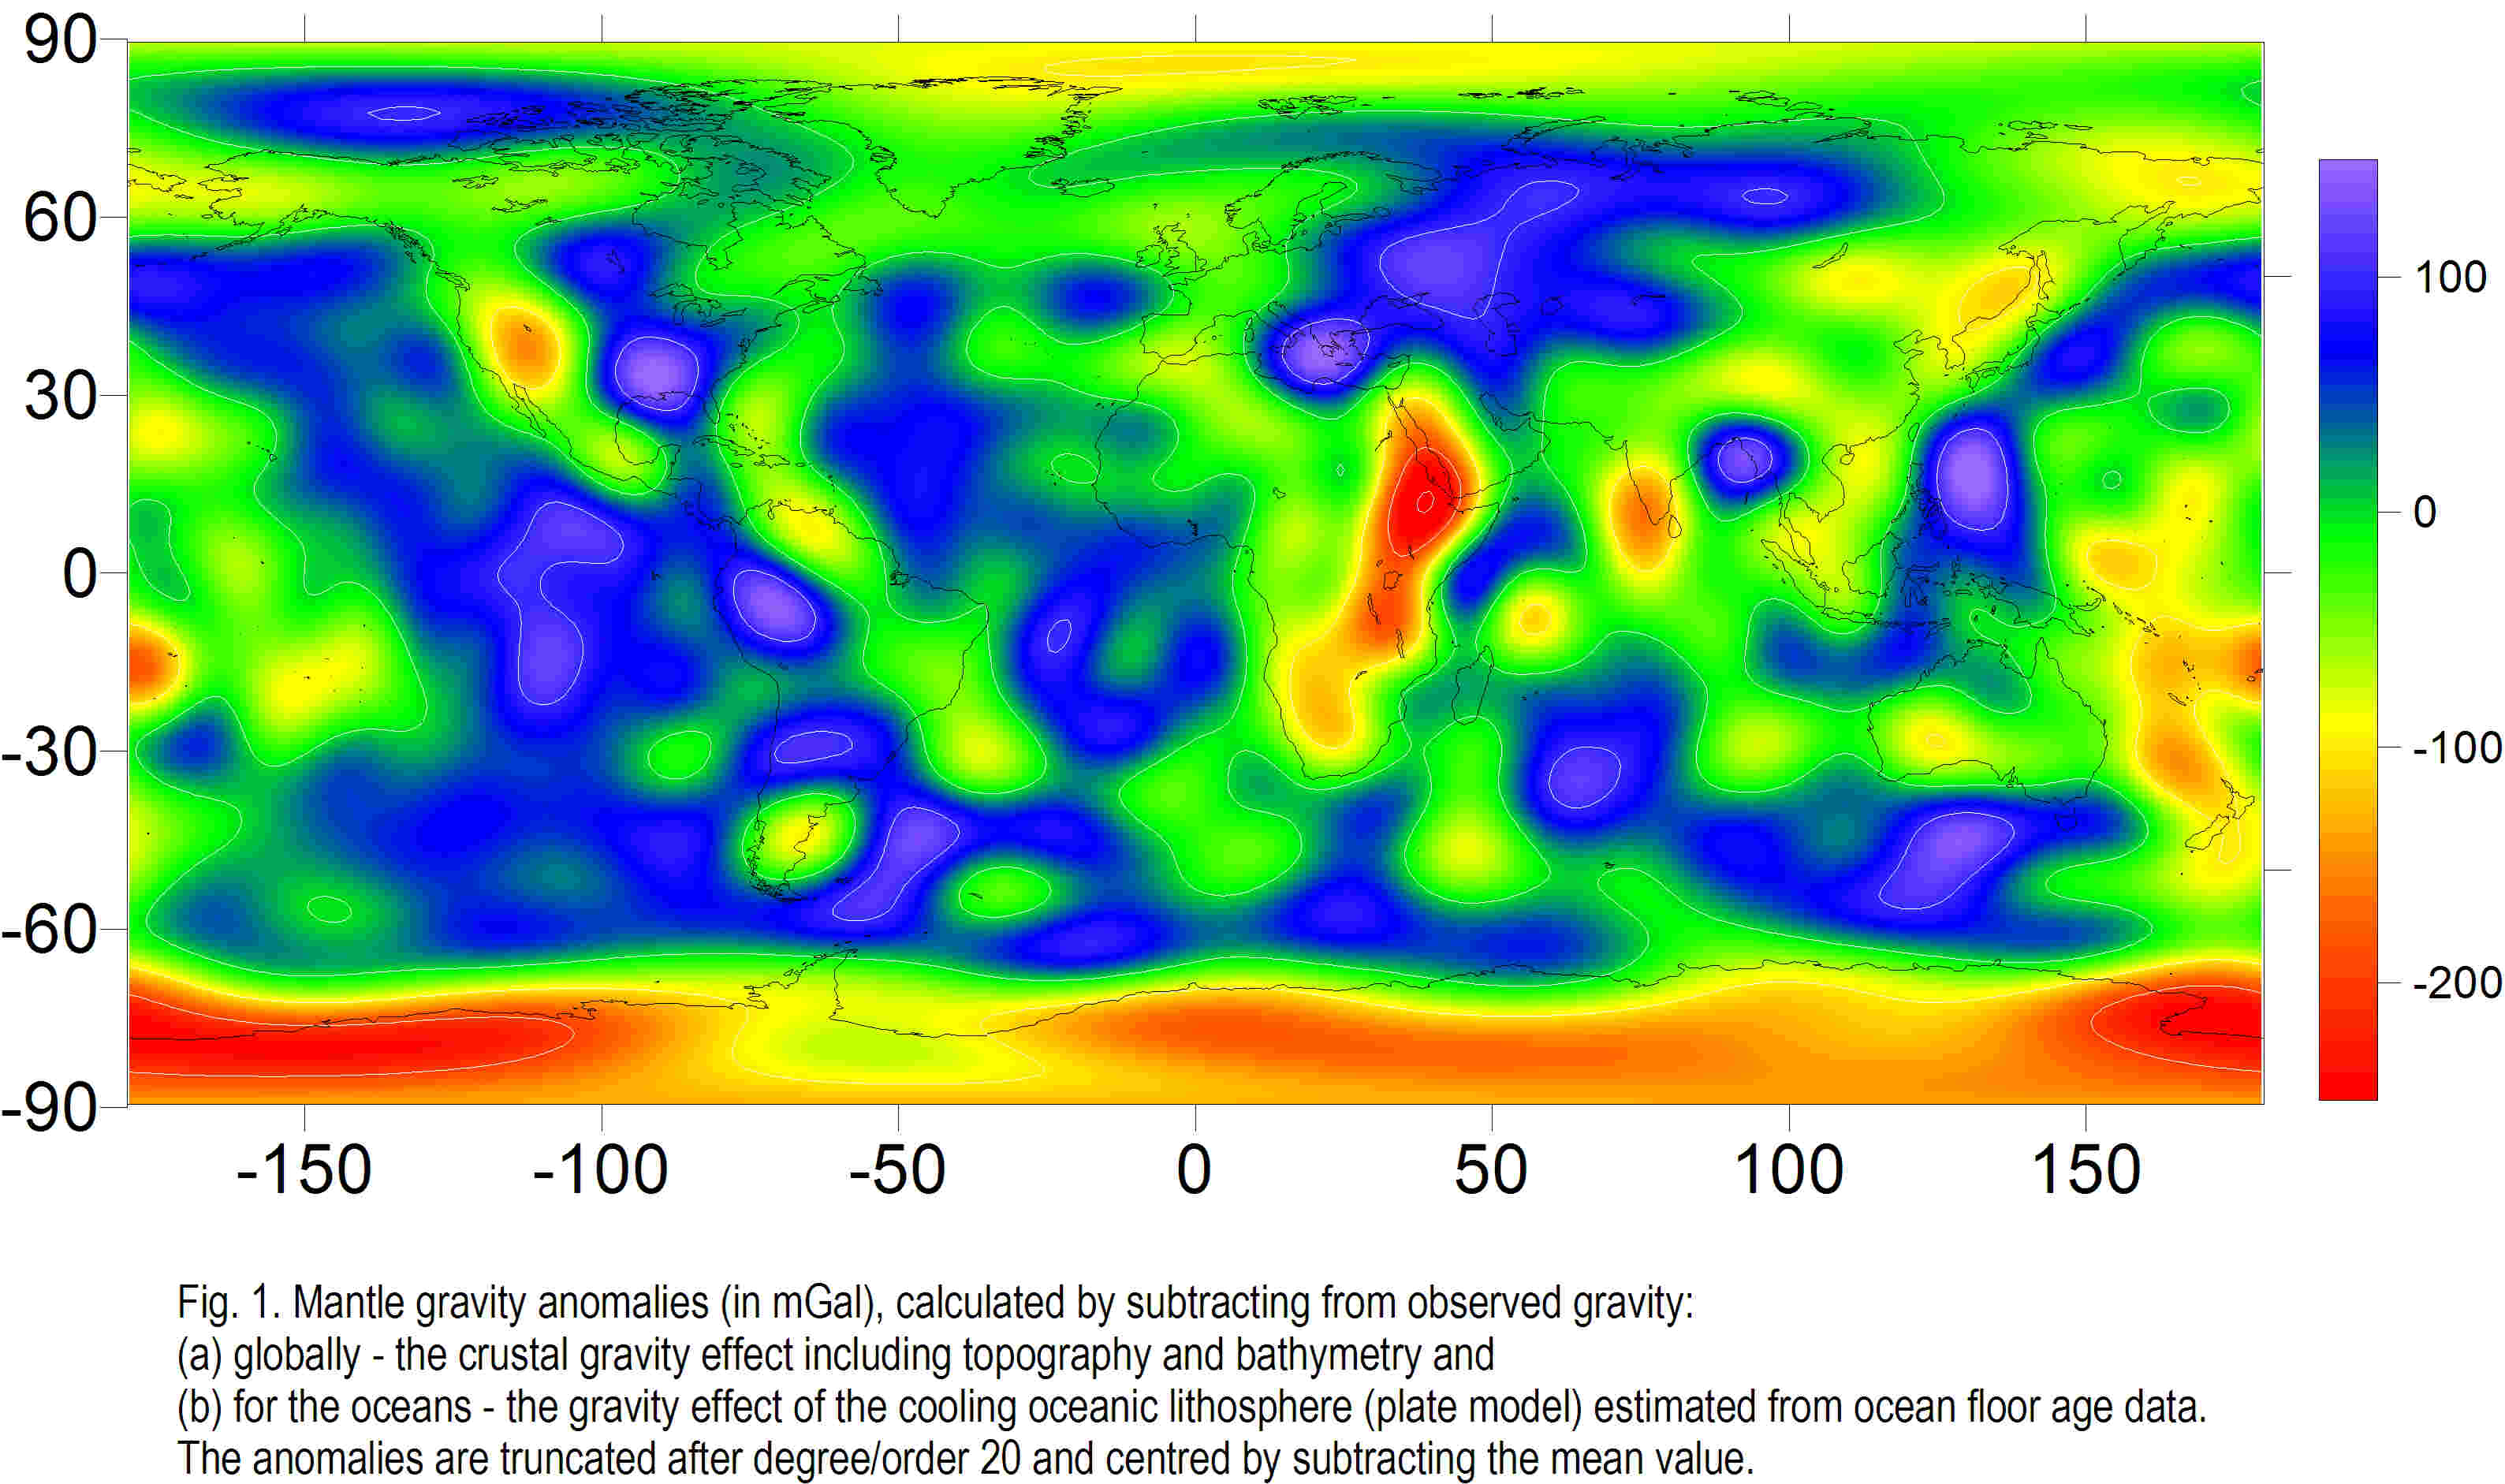
1. We find that the mantle gravity anomalies (Fig. 1) vary globally from
–250 mGal to +150 mGal, with the largest negative anomalies, indicating a
low-density lithosphere, being associated with vast Cenozoic regions of
plume-lithosphere interaction: the East-African Rift, and the Basin and
Range Province of the western USA. The largest positive anomalies are
associated over the continents with the Andes, the East European Platform,
the Alpine-Mediterranean fold belt and the central - south-eastern part of
North America. In the oceanic regions there are positive anomalies in parts
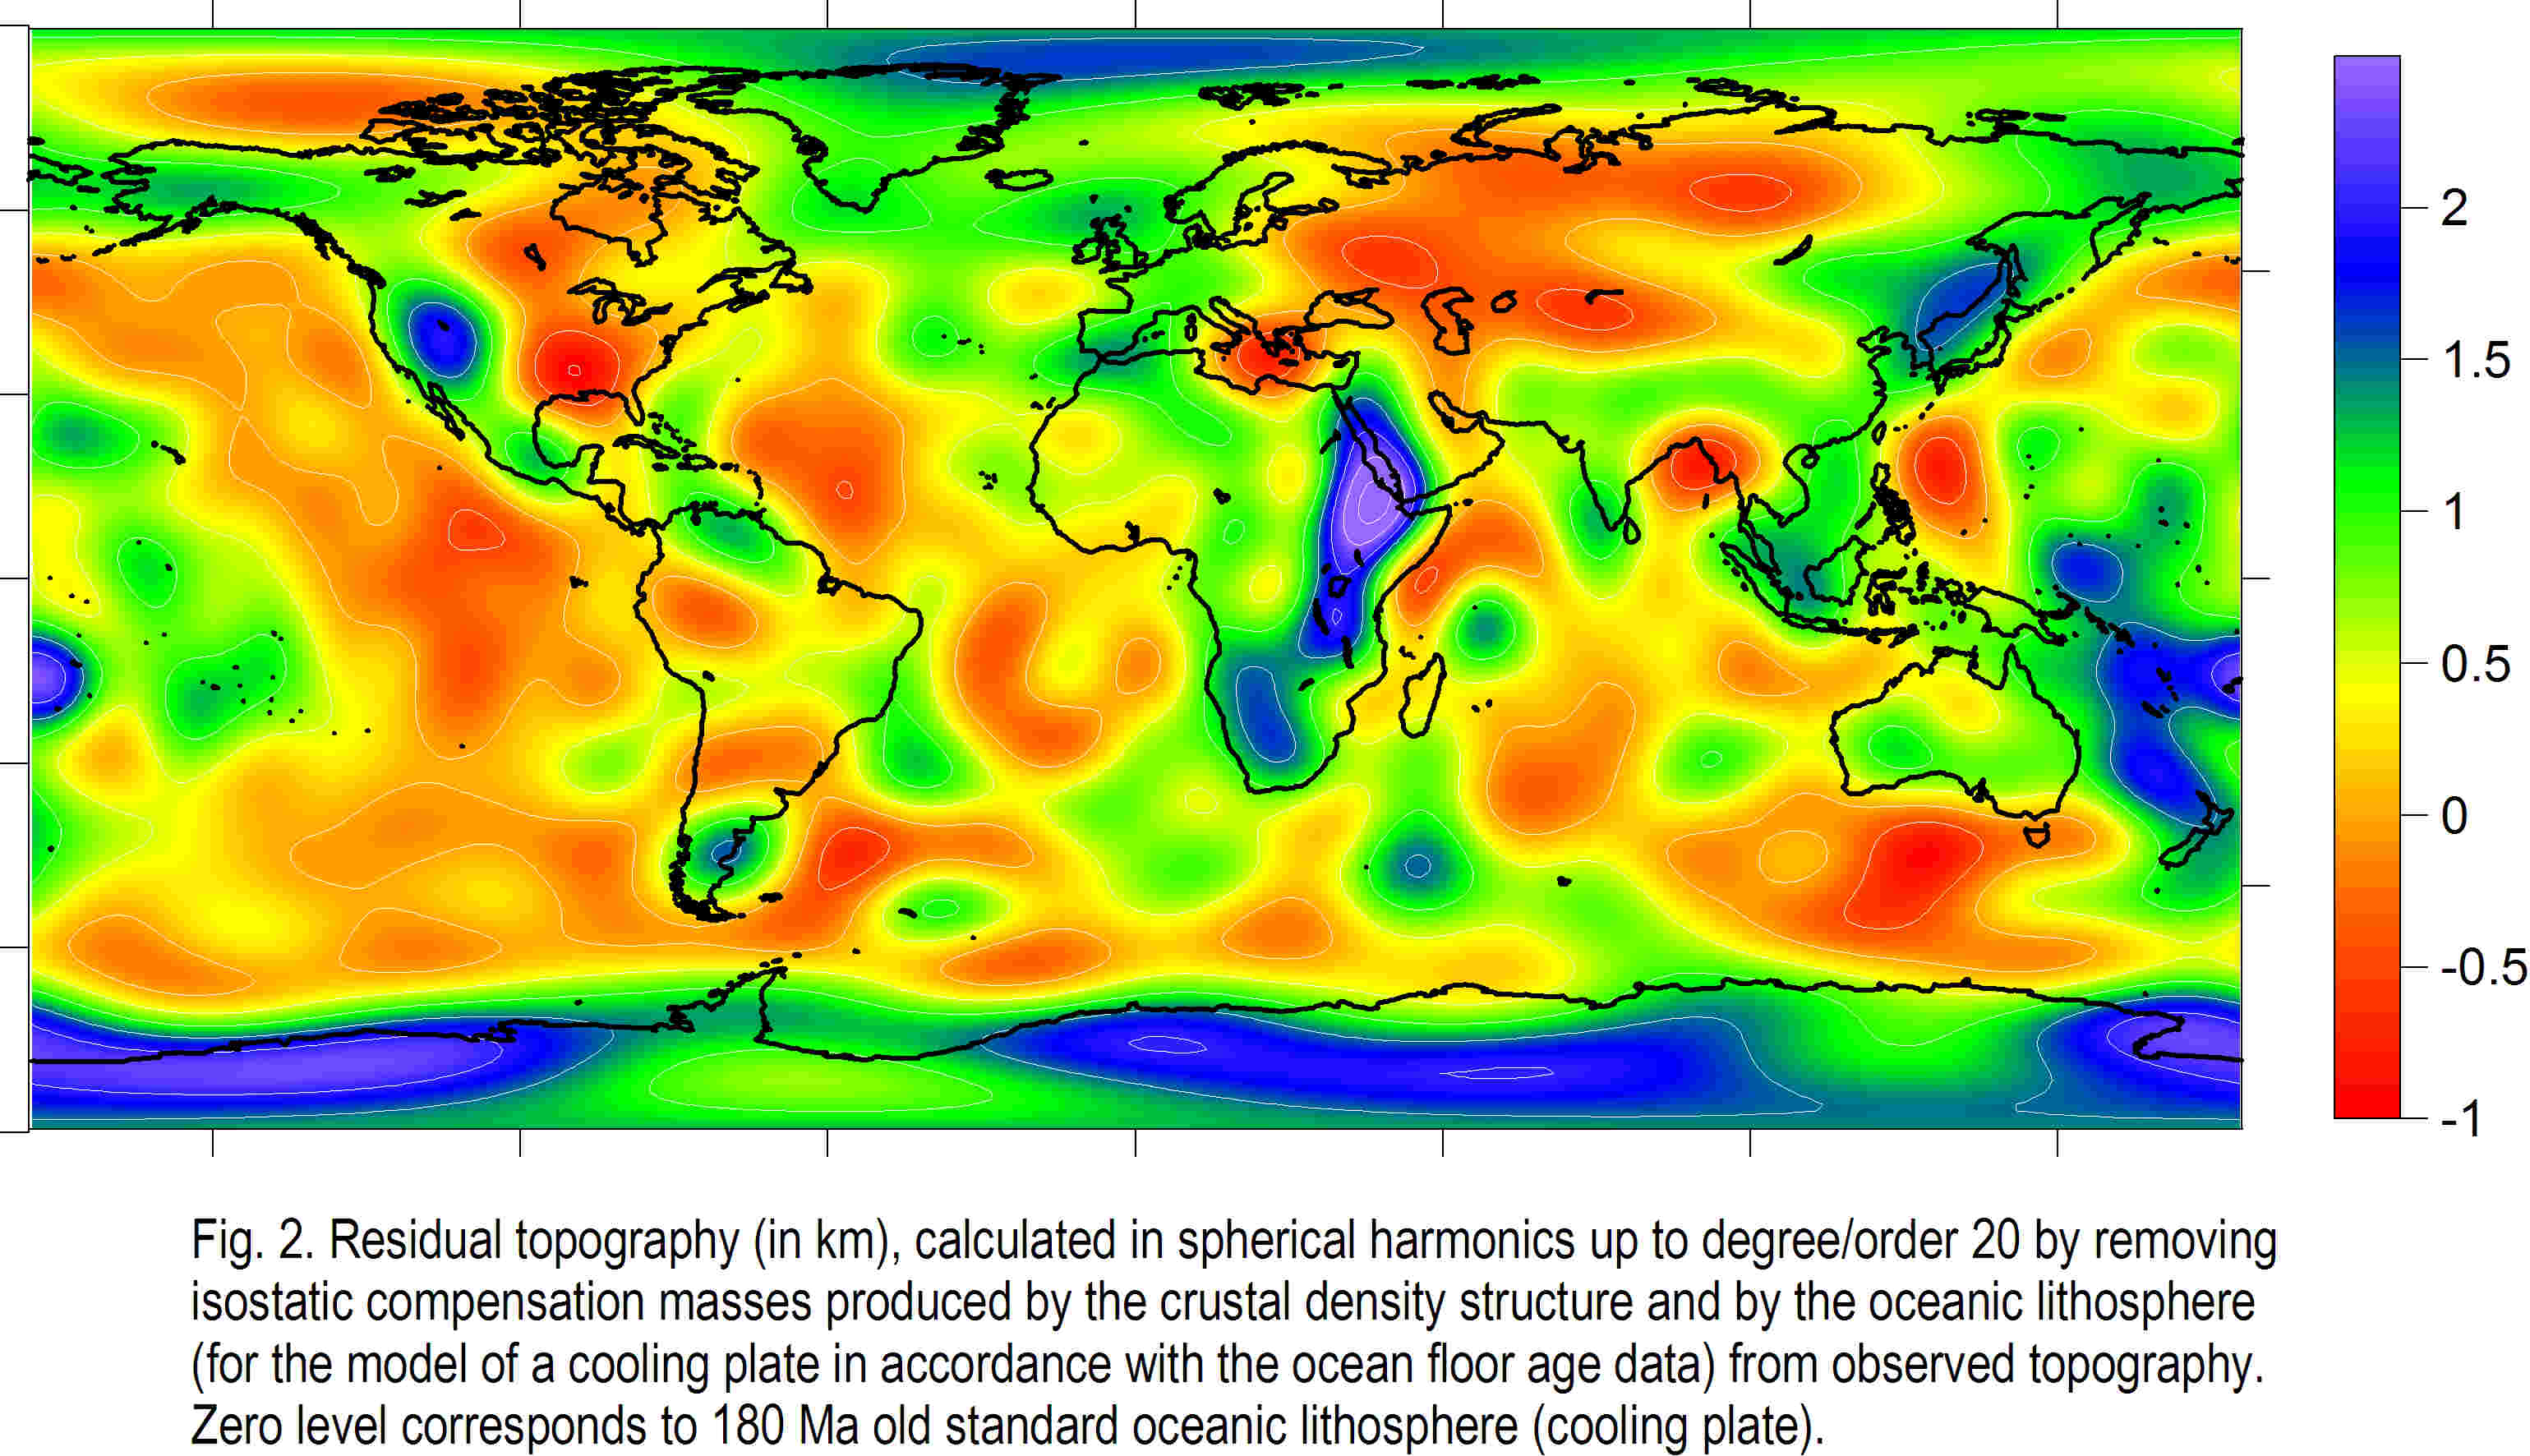
of the western Pacific. The residual topography variations (Fig. 2), which
besides a dynamically supported component indicate mass excess or mass
deficiency in the upper mantle required for isostatic equilibrium, are
inversely correlated with the residual gravity anomalies.
2. For cratonic areas, we deduce from the gravity and topography data a
large range of density anomalies in the subcrustal lithosphere,
produced by both temperature and compositional variations (Fig. 11). The
cratonic areas fall into two main groups. The largest positive residual gravity
anomalies and the most significant negative residual topography are
observed over Precambrian Eurasia (the Baltic Shield, the East European
Platform, the Ukrainian Shield, and the Siberian craton). Cratons of the
Southern hemisphere (Western Australia, the South American Craton, the
Indian Shield and South Africa) reveal negative mantle gravity anomalies
and positive residual topography, with the most pronounced anomalies
found for South Africa. The Canadian Shield and West Africa have an
intermediate position between these two groups. The cratons of the first
group have a dense lithospheric mantle, while for the cratons of the second
group the average lithospheric density is less than upper mantle density
beneath old ocean, which is here taken as the reference lithosphere.
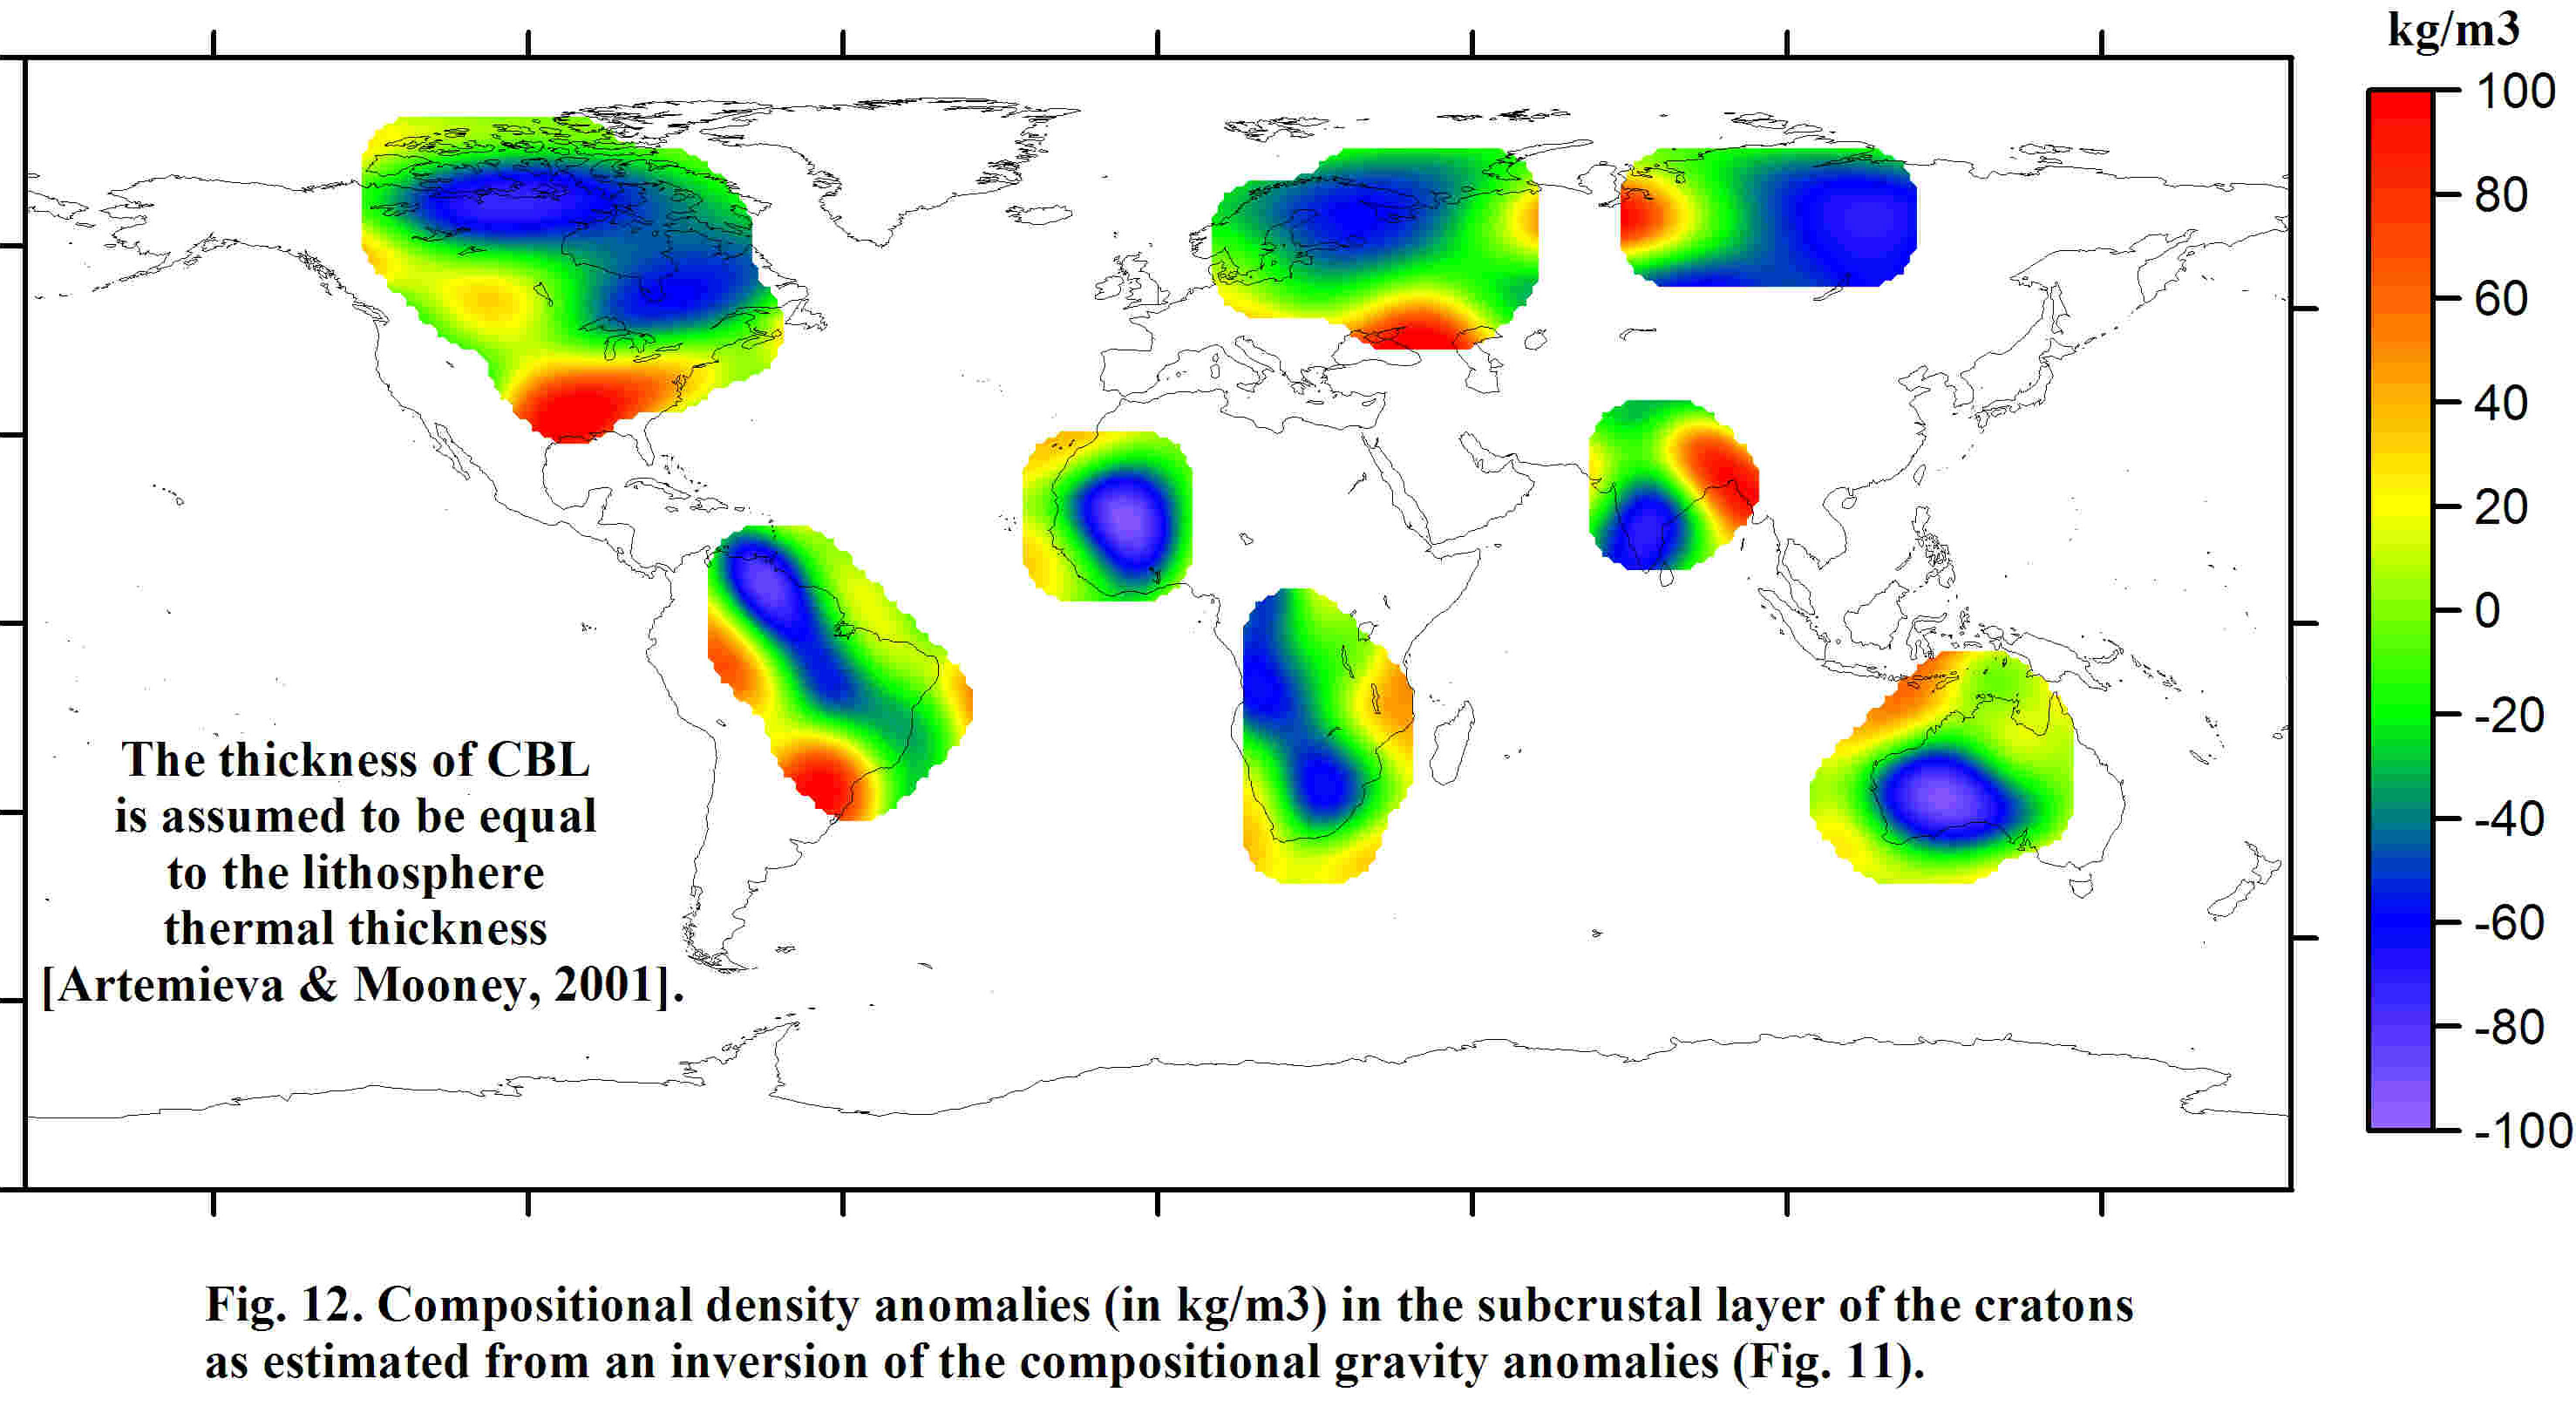
3. We account for the thermal state of the lithosphere to separate the
effects of composition and thermal expansion on density anomalies
(Fig. 12). Our analysis is based on the recent calculations of the thermal
regime of stable continental lithosphere [Artemieva & Mooney, 2001].
Gravity anomalies induced by temperature variations in the cratonic
lithosphere are typically greater than 100 mGal and in some regions (the
Baltic Shield, the Siberian craton, and the West African craton) reach 250
mGal. We found that the temperature induced gravity anomalies under
cratons are well correlated with mantle gravity anomalies but the total
amplitude of the latter is 1.5 times smaller than the range of pure
temperature-induced gravity anomalies. This means that the density
variations due to temperature are only partly (about 40%) compensated by
density variations due to compositional differences. This conclusion
contradicts the classical isopycnic hypothesis of Jordan that predicts a
complete balance between thermal and compositional buoyancy anomalies
in the cratonic lithosphere. A plausible explanation is variation in the amount
of compensation between thermal and compositional density changes with
depth, and this is supported by recent petrological studies.
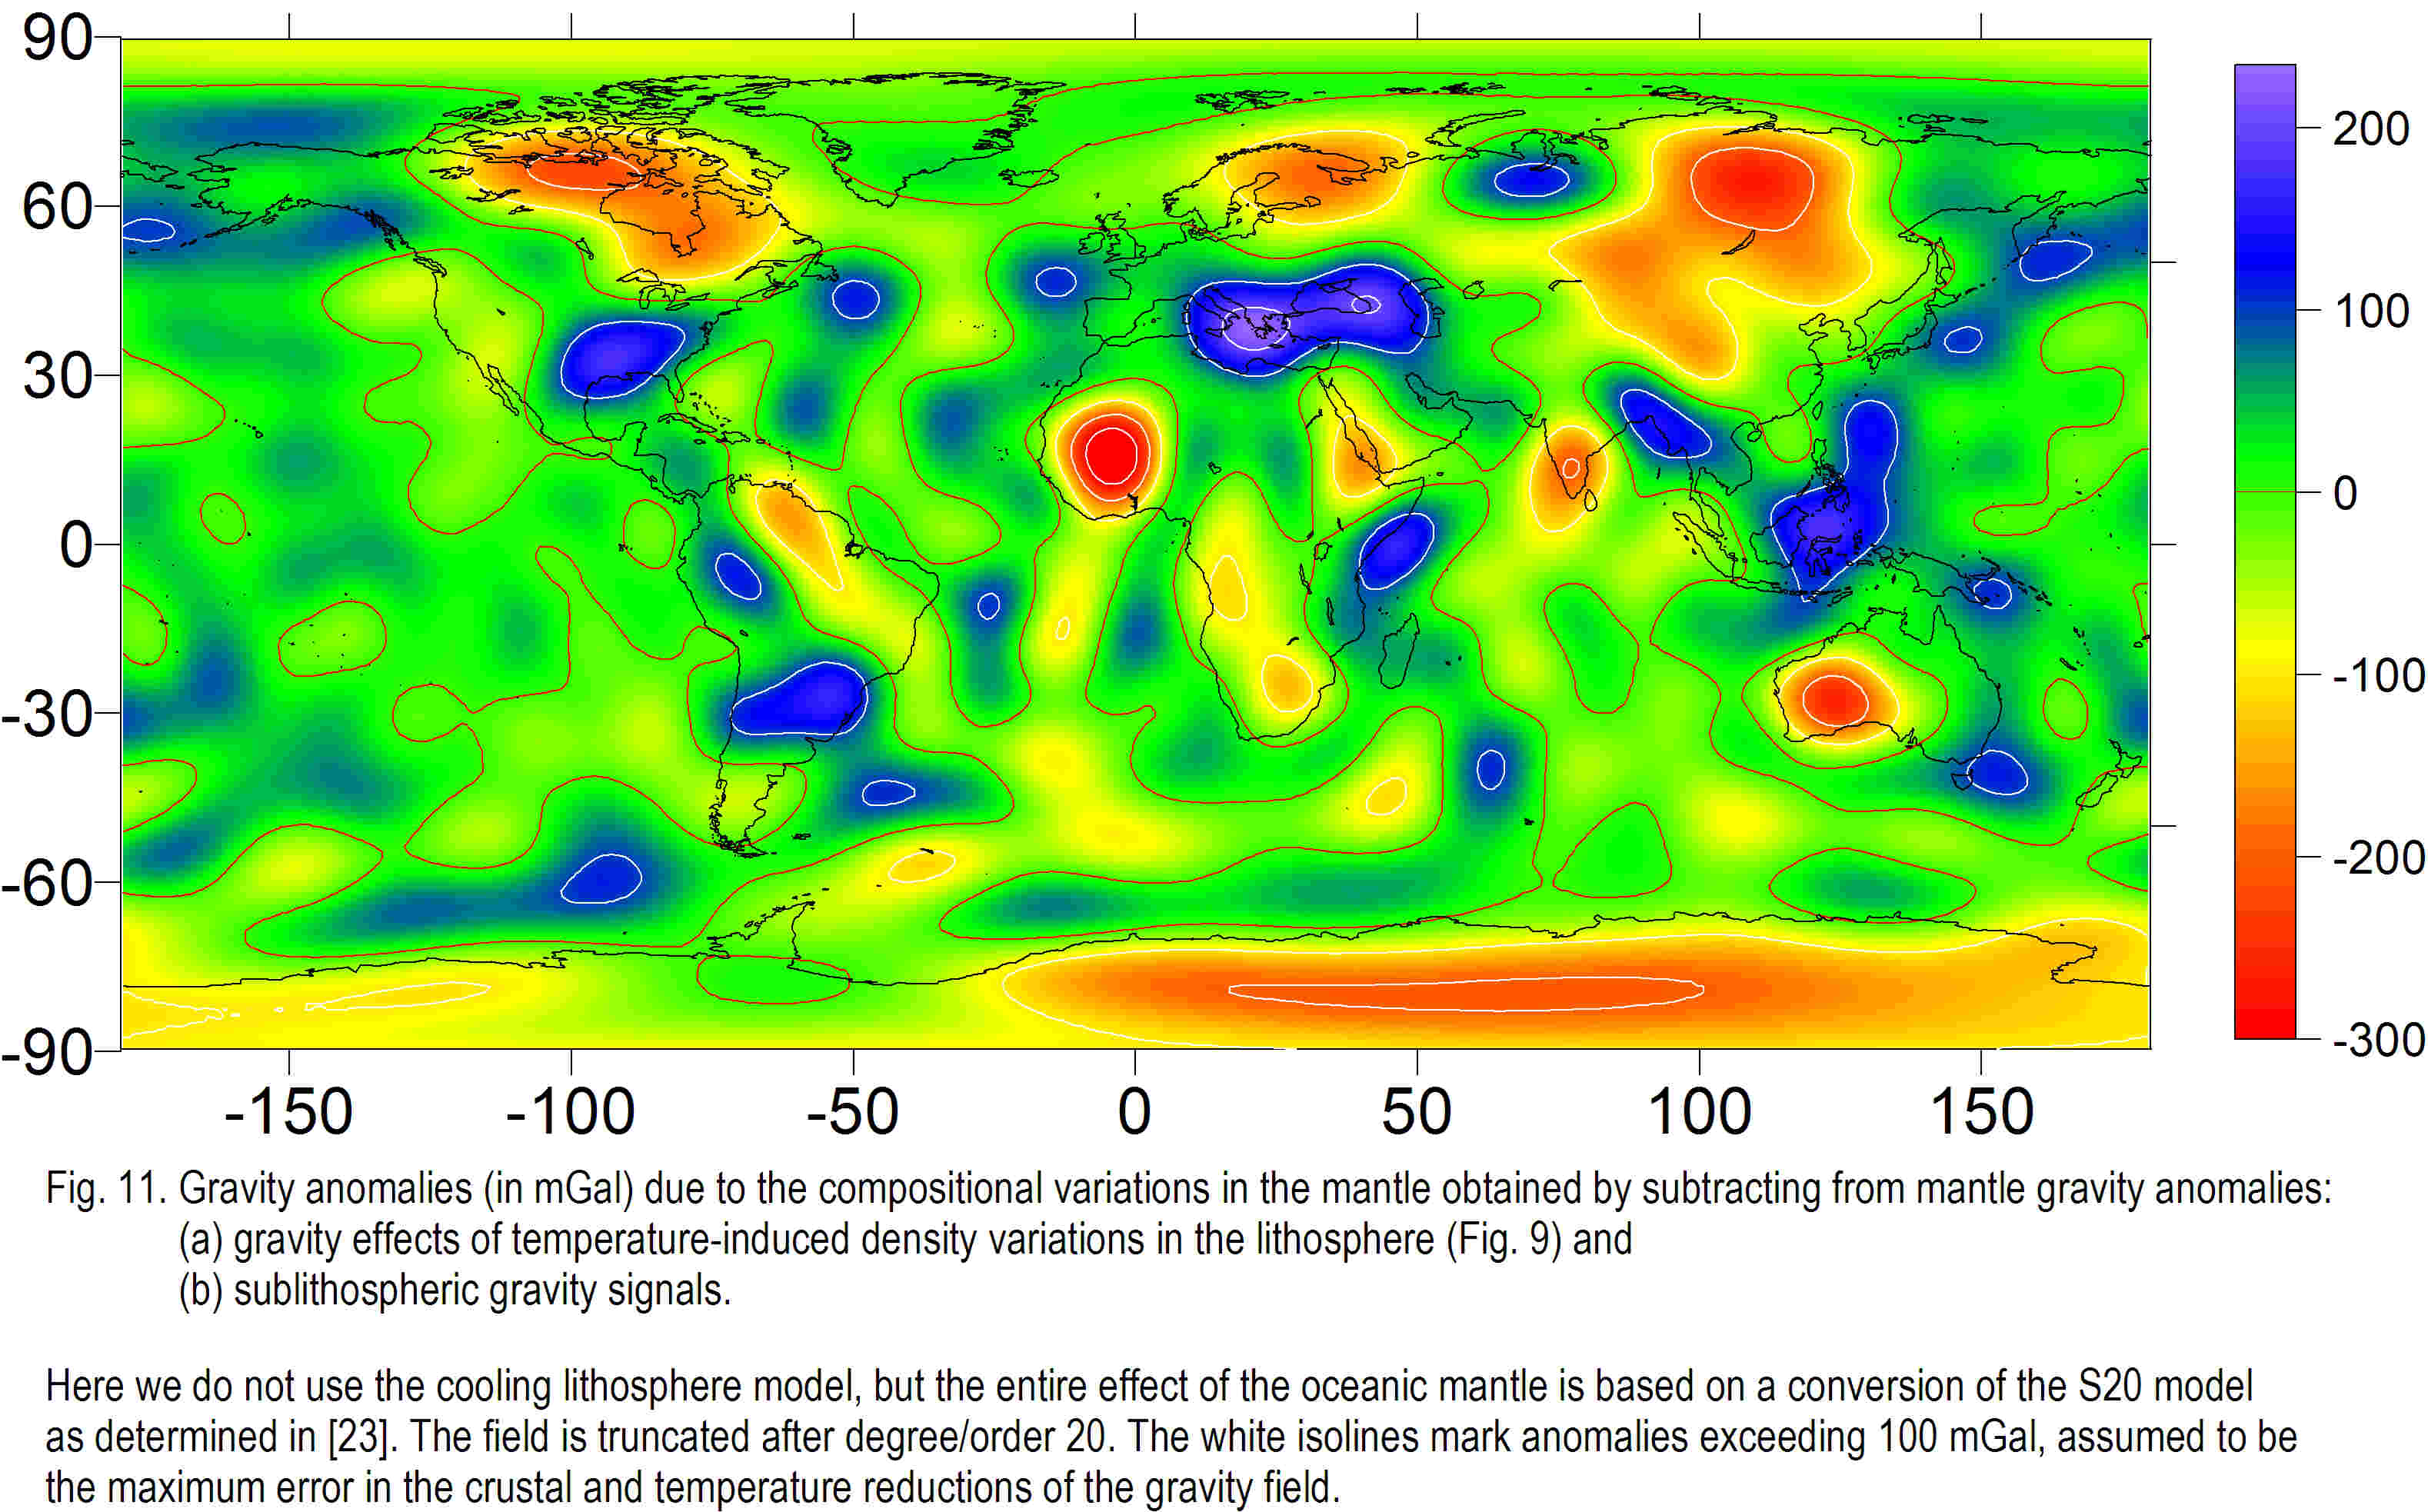
4. We calculate the gravity effect of compositional variations in the
lithosphere by subtracting temperature-induced gravity anomalies from the
mantle gravity anomalies (Figs. 12-13). These compositional gravity
anomalies vary from –300 mGal to +220 mGal. The cratonic areas are
characterised by pronounced gravity lows, typically within the range –150 to
–250 mGal, implying corresponding compositional changes. Large positive
compositional gravity anomalies are found in two distinct regions: (1) near
ocean-continent and continent-continent subduction zones, and (2) within
some continental interiors, e.g. in the southern part of North America. The
origin of the latter positive anomalies is uncertain.
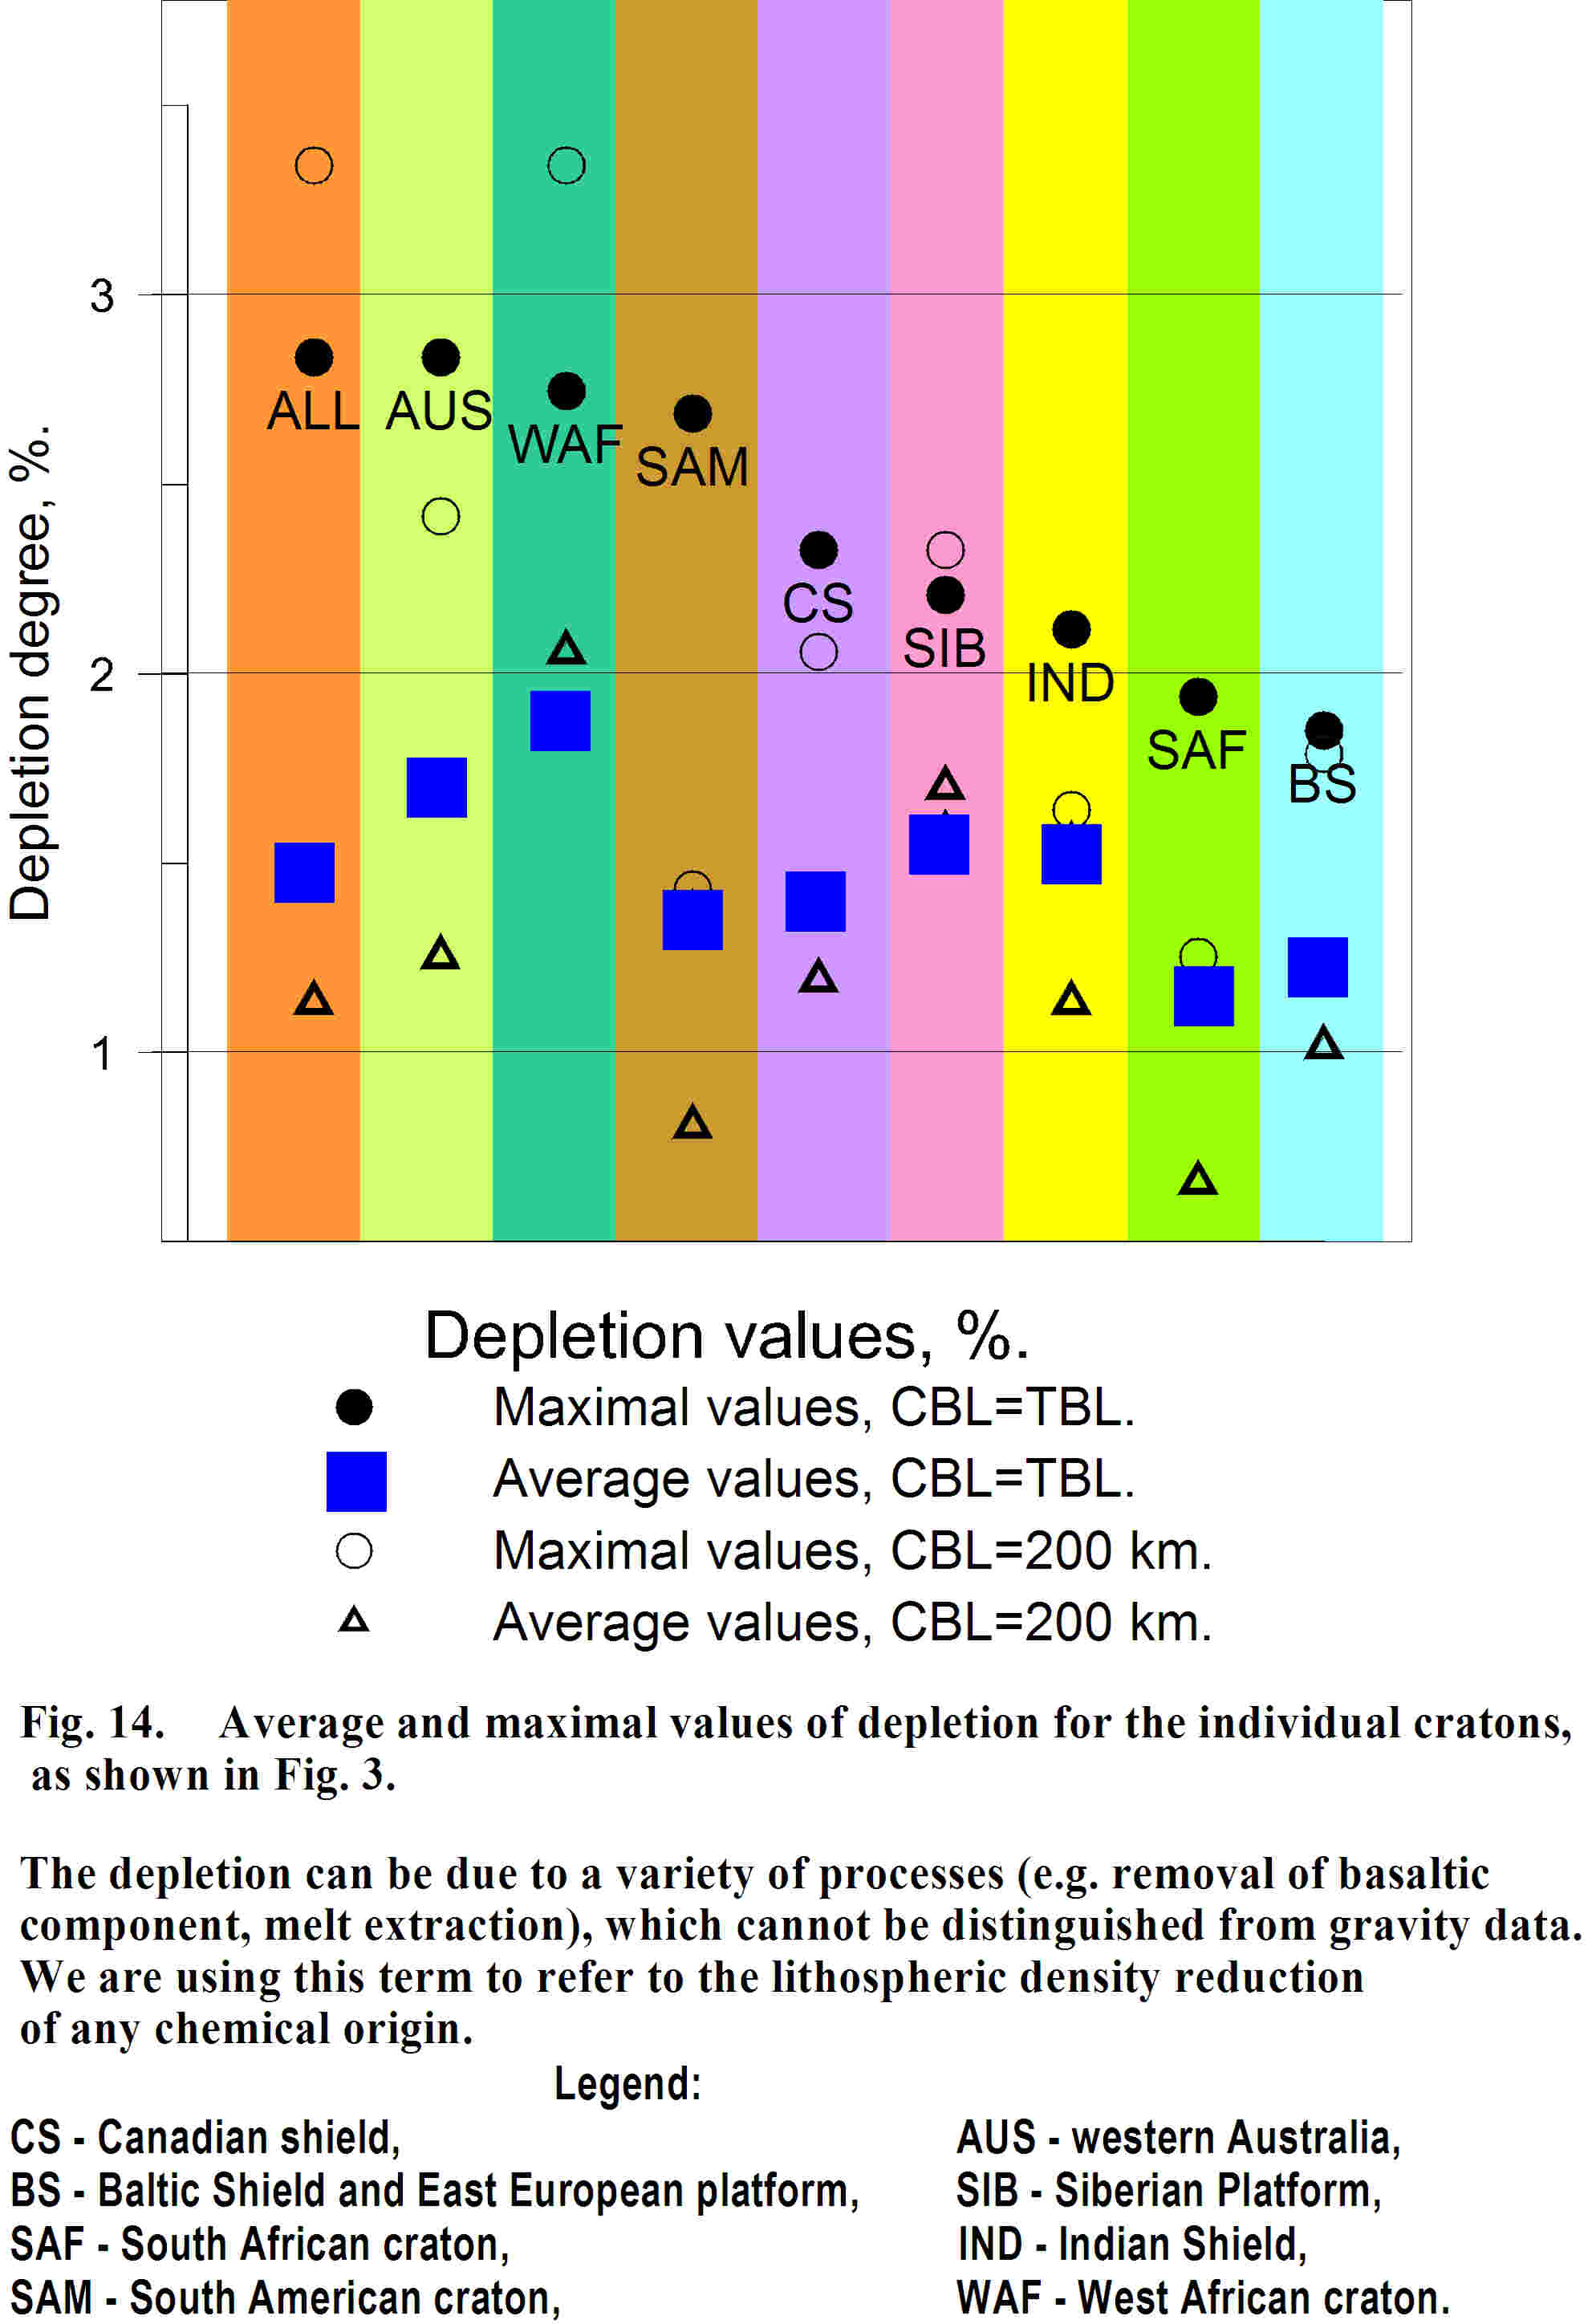
5. We produce a map of compositional density anomalies in the
cratonic lithosphere and compare the degree of depletion between
different continental roots (Fig. 14). The average depletion for the individual
cratons varies only slightly, between 1.1% to 1.5%, assuming that the
thickness of the chemical boundary layer is proportional to the thermal
boundary layer thickness. These values depend to some extent on the ratio
between Archean and Proterozoic lithosphere within each of the cratons.
The maximal values of depletion are within the interval 1.7-2.5 %, and
should characterize the Archean portion of each area. This result is in
excellent agreement with petrological studies.
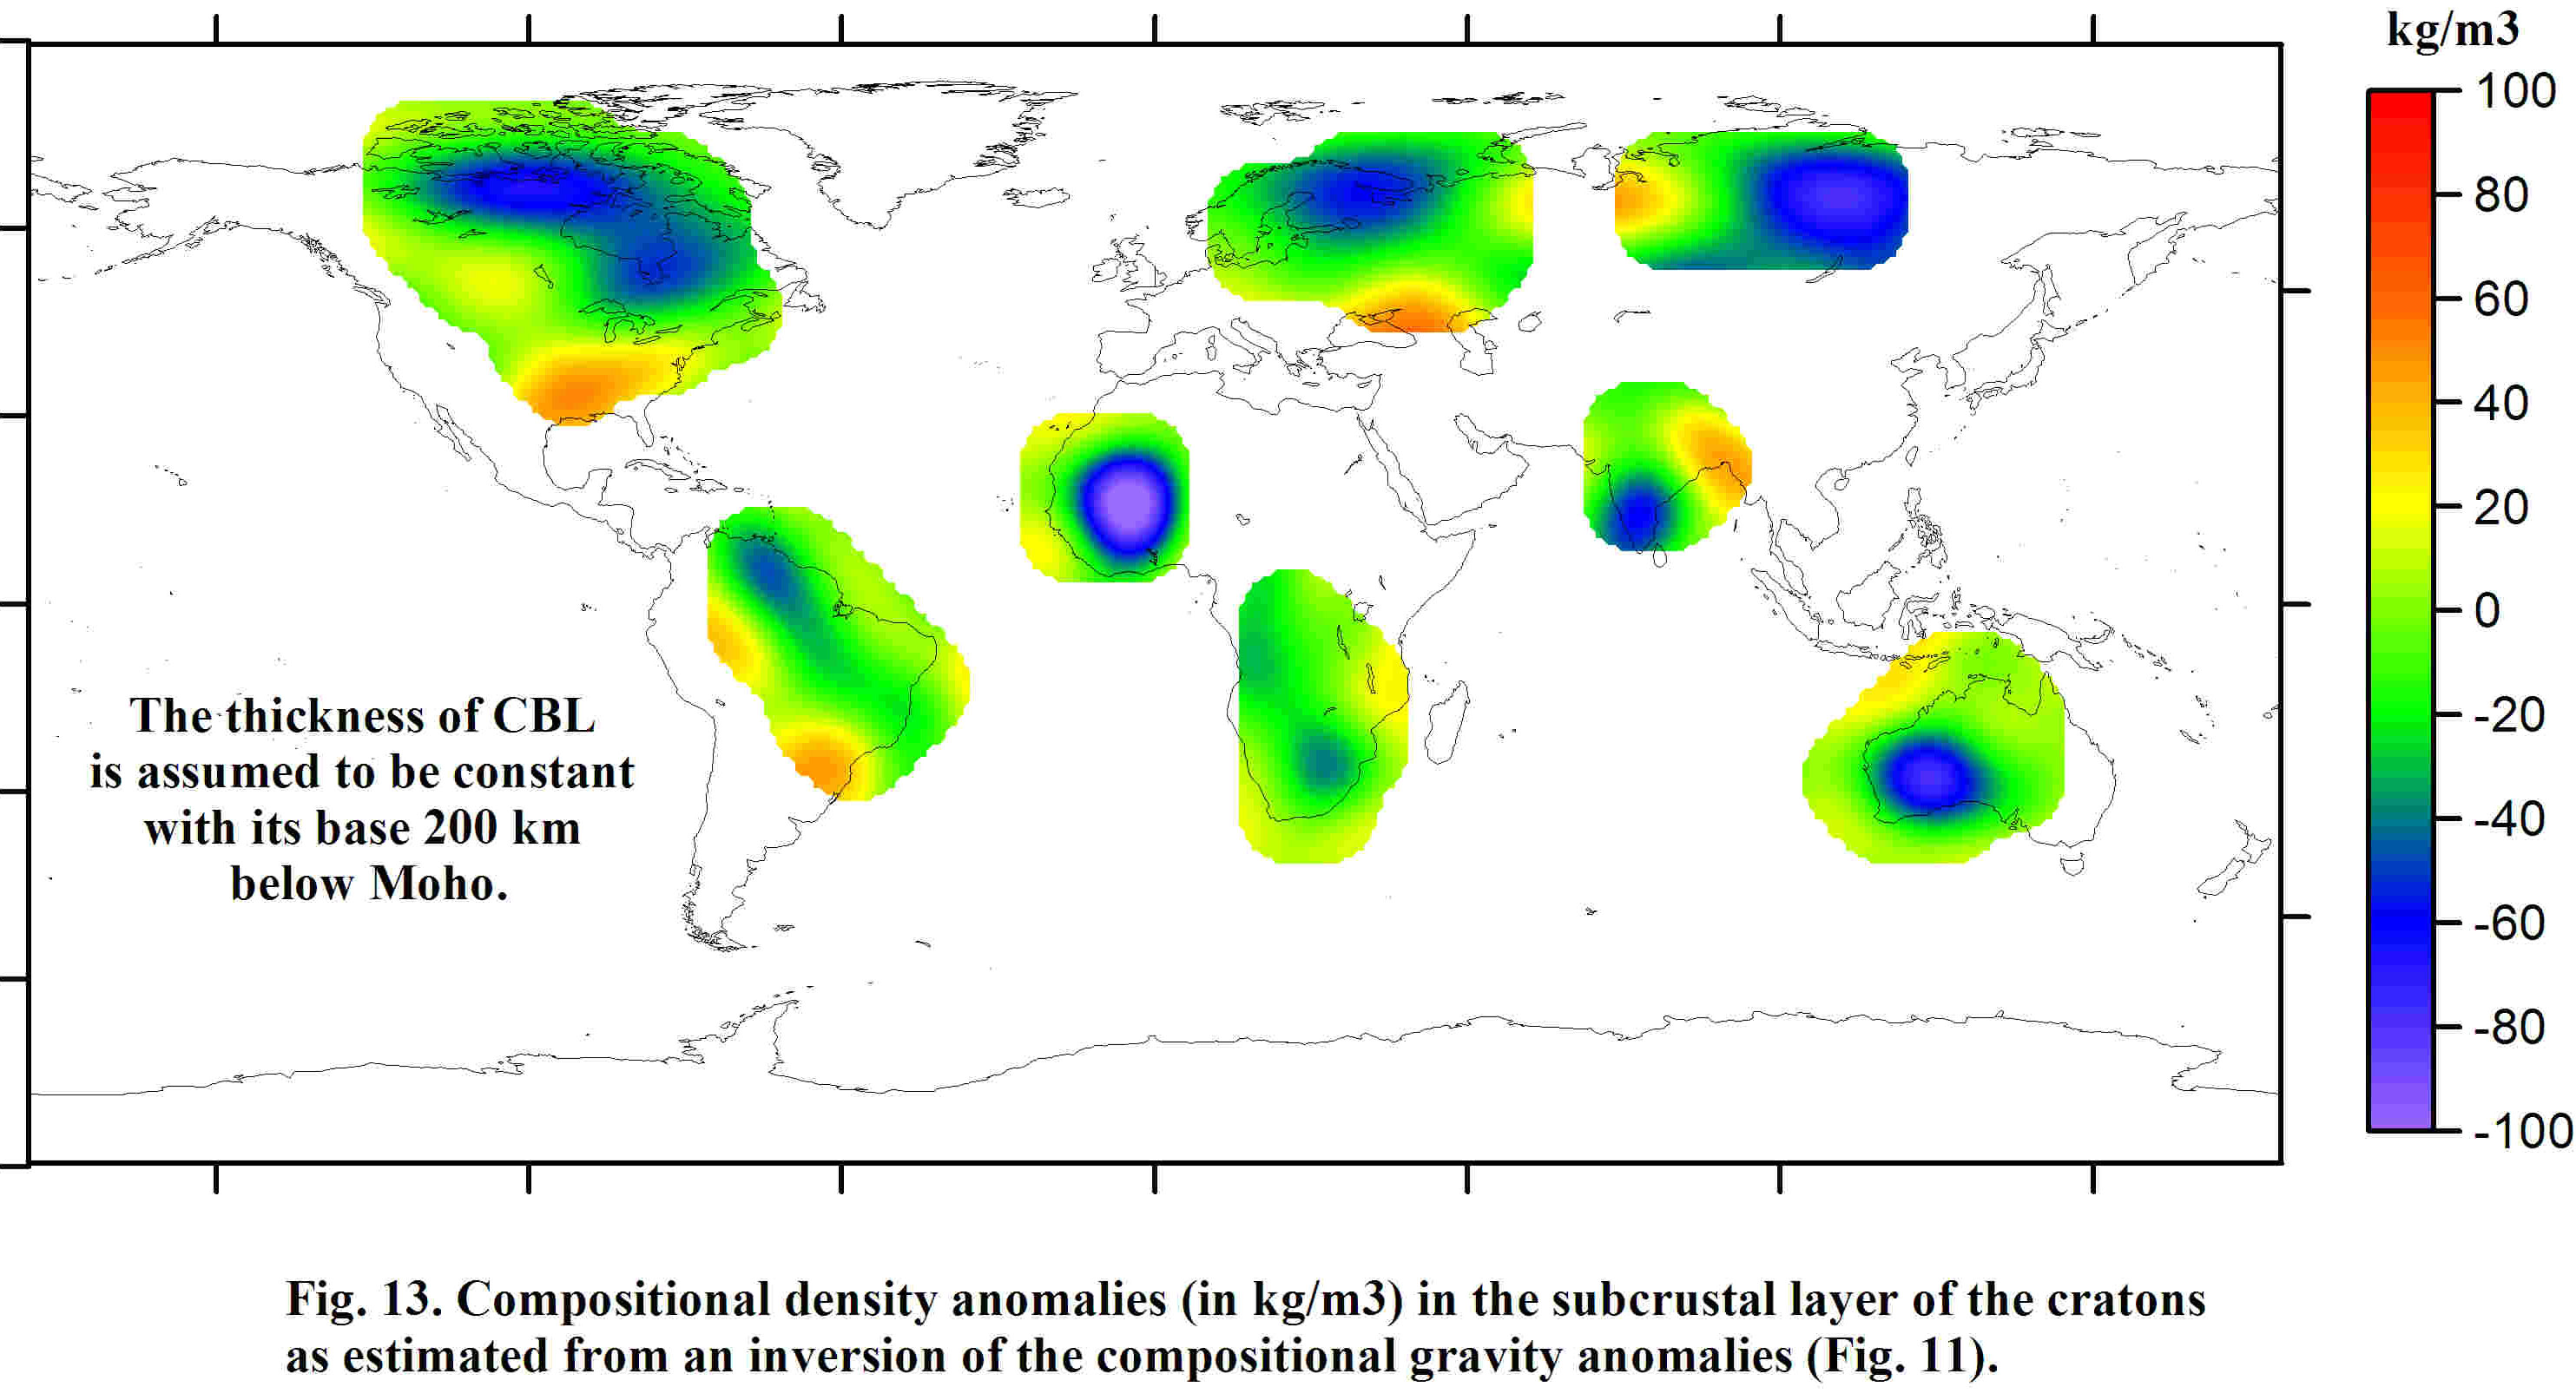
If we assume that the thickness of the CBL is constant for all the cratons
(Fig. 13), the obtained composition density anomalies vary much more
between the individual roots. For a 200 km thick CBL, the values of
depletion averaged over each craton are in between 0.6-1.5 %, with peaks
from 1.2% to 2.4 %.
beneath continents. Our analysis is based on the interpretation of residual
topography and mantle gravity anomalies, calculated by subtracting the
crustal effects from the observed field, and on the upper mantle temperature
variations estimated from heat flow and seismic tomography data.
1. We find that the mantle gravity anomalies (Fig. 1) vary globally from
–250 mGal to +150 mGal, with the largest negative anomalies, indicating a
low-density lithosphere, being associated with vast Cenozoic regions of
plume-lithosphere interaction: the East-African Rift, and the Basin and
Range Province of the western USA. The largest positive anomalies are
associated over the continents with the Andes, the East European Platform,
the Alpine-Mediterranean fold belt and the central - south-eastern part of
North America. In the oceanic regions there are positive anomalies in parts
of the western Pacific. The residual topography variations (Fig. 2), which
besides a dynamically supported component indicate mass excess or mass
deficiency in the upper mantle required for isostatic equilibrium, are
inversely correlated with the residual gravity anomalies.
2. For cratonic areas, we deduce from the gravity and topography data a
large range of density anomalies in the subcrustal lithosphere,
produced by both temperature and compositional variations (Fig. 11). The
cratonic areas fall into two main groups. The largest positive residual gravity
anomalies and the most significant negative residual topography are
observed over Precambrian Eurasia (the Baltic Shield, the East European
Platform, the Ukrainian Shield, and the Siberian craton). Cratons of the
Southern hemisphere (Western Australia, the South American Craton, the
Indian Shield and South Africa) reveal negative mantle gravity anomalies
and positive residual topography, with the most pronounced anomalies
found for South Africa. The Canadian Shield and West Africa have an
intermediate position between these two groups. The cratons of the first
group have a dense lithospheric mantle, while for the cratons of the second
group the average lithospheric density is less than upper mantle density
beneath old ocean, which is here taken as the reference lithosphere.
3. We account for the thermal state of the lithosphere to separate the
effects of composition and thermal expansion on density anomalies
(Fig. 12). Our analysis is based on the recent calculations of the thermal
regime of stable continental lithosphere [Artemieva & Mooney, 2001].
Gravity anomalies induced by temperature variations in the cratonic
lithosphere are typically greater than 100 mGal and in some regions (the
Baltic Shield, the Siberian craton, and the West African craton) reach 250
mGal. We found that the temperature induced gravity anomalies under
cratons are well correlated with mantle gravity anomalies but the total
amplitude of the latter is 1.5 times smaller than the range of pure
temperature-induced gravity anomalies. This means that the density
variations due to temperature are only partly (about 40%) compensated by
density variations due to compositional differences. This conclusion
contradicts the classical isopycnic hypothesis of Jordan that predicts a
complete balance between thermal and compositional buoyancy anomalies
in the cratonic lithosphere. A plausible explanation is variation in the amount
of compensation between thermal and compositional density changes with
depth, and this is supported by recent petrological studies.
4. We calculate the gravity effect of compositional variations in the
lithosphere by subtracting temperature-induced gravity anomalies from the
mantle gravity anomalies (Figs. 12-13). These compositional gravity
anomalies vary from –300 mGal to +220 mGal. The cratonic areas are
characterised by pronounced gravity lows, typically within the range –150 to
–250 mGal, implying corresponding compositional changes. Large positive
compositional gravity anomalies are found in two distinct regions: (1) near
ocean-continent and continent-continent subduction zones, and (2) within
some continental interiors, e.g. in the southern part of North America. The
origin of the latter positive anomalies is uncertain.
5. We produce a map of compositional density anomalies in the
cratonic lithosphere and compare the degree of depletion between
different continental roots (Fig. 14). The average depletion for the individual
cratons varies only slightly, between 1.1% to 1.5%, assuming that the
thickness of the chemical boundary layer is proportional to the thermal
boundary layer thickness. These values depend to some extent on the ratio
between Archean and Proterozoic lithosphere within each of the cratons.
The maximal values of depletion are within the interval 1.7-2.5 %, and
should characterize the Archean portion of each area. This result is in
excellent agreement with petrological studies.
If we assume that the thickness of the CBL is constant for all the cratons
(Fig. 13), the obtained composition density anomalies vary much more
between the individual roots. For a 200 km thick CBL, the values of
depletion averaged over each craton are in between 0.6-1.5 %, with peaks
from 1.2% to 2.4 %.
| Last modified December, 2013, irina@geo.ku.dk |
Kaban M.K., Schwintzer P., Artemieva I.M.,
and Mooney W.D.
Earth Planet. Sci. Lett., v. 209, 53-69, 2003.
and Mooney W.D.
Earth Planet. Sci. Lett., v. 209, 53-69, 2003.
| Fig. 1. Mantle gravity anomalies (in mGal), calculated by subtracting from observed gravity: (a) globally - the crustal gravity effect including topography and bathymetry and (b) for the oceans – the gravity effect of the cooling oceanic lithosphere (plate model) estimated from ocean floor age data. The anomalies are truncated after degree/order 20 and centred by subtracting the mean value. |
| Fig. 2. Residual topography (in km), calculated in spherical harmonics up to degree/order 20 by removing isostatic compensation masses produced by the crustal density structure and by the oceanic lithosphere (for the model of a cooling plate in accordance with the ocean floor age data) from observed topography. Zero level corresponds to 180 Ma old standard oceanic lithosphere (cooling plate). |
| Fig. 11. Gravity anomalies (in mGal) due to the compositional variations in the mantle obtained by subtracting from mantle gravity anomalies: (a) gravity effects of temperature-induced density variations in the lithosphere (Fig. 9) and (b) sublithospheric gravity signals. Here we do not use the cooling lithosphere model, but the entire effect of the oceanic mantle is based on a conversion of the S20 model. The field is truncated after degree/order 20. The white isolines mark anomalies exceeding 100 mGal, assumed to be the maximum error in the crustal and temperature reductions of the gravity field. |
| Fig. 12. Compositional density anomalies (in kg/m3) in the subcrustal layer of the cratons as estimated from an inversion of the compositional gravity anomalies. For inversion, the thickness of CBL is assumed to be equal to the lithosphere thermal thickness [Artemieva & Mooney, 2001]. |
| Fig. 13. Compositional density anomalies (in kg/m3) in the subcrustal layer of the cratons as estimated from an inversion of the compositional gravity anomalies (Fig. 11). For inversion, the thickness of CBL is assumed to be constant with its base 200 km below Moho |
| Fig. 14. Average and maximal values of depletion for the individual cratons. The depletion can be due to a variety of processes (e.g. removal of basaltic component, melt extraction), which cannot be distinguished from gravity data. We are using this term to refer to the lithospheric density reduction of any chemical origin. Legend: CS – Canadian shield, AUS – western Australia, BS – Baltic Shield and East European platform, SIB – Siberian Platform, SAF – South African craton, IND – Indian Shield, SAM - South American craton, WAF - West African craton. |

Irina Artemieva: Research highlights
- THE CONTINENTAL LITHOSPHERE
| |
| |
| |
| |
| |
| |
| |
| |
| |
| |
- THE CONTINENTAL LITHOSPHERE

| THERMAL REGIME, STRUCTURE, AND EVOLUTION |