
| Last modified December, 2013; irina@ign.ku.dk |
Thermal lithosphere and LAB
THE LITHOSPHERE
| The site is being updated irregularly |
Number of page visits
|
THERMAL THICKNESS AND EVOLUTION OF
PRECAMBRIAN LITHOSPHERE:
A GLOBAL STUDY
The thermal thickness of Precambrian lithosphere is modeled and compared
with estimates from seismic tomography and xenolith data. We use the
steady-state thermal conductivity equation with the same geothermal
constraints for all of the Precambrian cratons (except Antarctica) to calculate
the temperature distribution in the stable continental lithosphere. The modeling
is based on the global compilation of heat flow data by Pollack et al. (1993) and
more recent data. The depth distribution of heat-producing elements is
estimated using regional models for about 300 blocks with sizes varying from
1deg x 1deg to about 5deg x 5deg in latitude and longitude and is constrained
by laboratory, seismic and petrologic data and, where applicable, empirical heat
flow/heat production relationships.
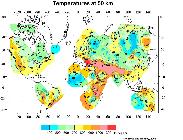
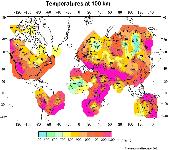
Maps of the lateral temperature distribution at depths 50, 100 and 150 km are
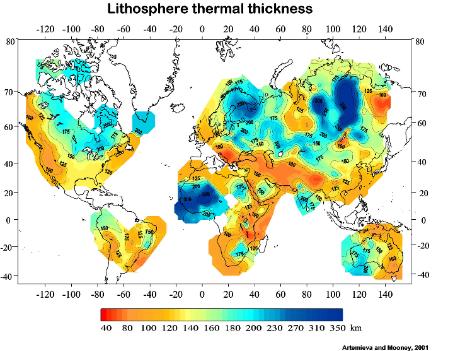
presented for all continents except Antarctica. The thermal thickness of the
lithosphere is calculated assuming a conductive layer overlying the mantle with
an adiabat of 1300 oC. The Archean and early Proterozoic lithosphere is found
to have two typical thicknesses, 200-220 km and 300-350 km. In general, thin
(~ 220 km) roots are found for Archean and early Proterozoic cratons in the
southern hemisphere (South Africa, Western Australia, South America and
India) and thicker (>300 km) roots are found in the northern hemisphere
(Baltic Shield, Siberian Platform, West Africa, and possibly the Canadian
Shield).
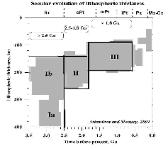
We find that the thickness of continental lithosphere generally decreases with
age, from >200 km beneath Archean cratons, to intermediate values of
200+/-50 km in early Proterozoic lithosphere, to about 140+/-50 km in middle
and late Proterozoic cratons. Using known crustal thickness, our calculated
geotherms, and assuming that isostatic balance is achieved at the base of the
lithosphere, we find that Archean and early Proterozoic mantle lithosphere is
1.5% less dense (chemically depleted) than the underlying asthenosphere, while
middle and late Proterozoic sub-crustal lithosphere should be depleted by ~
0.6-0.7 %. Our results suggest three contrasting stages of lithosphere
formation at the following ages: >2.5 Ga, 2.5-1.8 Ga, and <1.8 Ga. Ages of
komatiites, greenstone belts, and giant dike swarms broadly define similar
stages, and apparently reflect secular changes in mantle temperature and,
| Artemieva I.M. and Mooney W.D., 2001. Journal Geophysical Research, v. 106(B), 16387-16414 |
A global 1deg x 1deg thermal model for the continental lithosphere TC1 is an update of the 2001 model, based on the statistical analysis of lithosphere geotherms and geodynamic settings. TC1 fills-in "white spots" with no heat flow measurements. |
| Double-click to enlarge the maps |
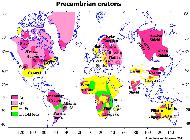
Map of Precambrian cratons
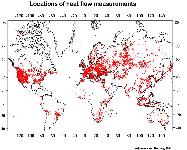
| Locations of heat flow measurements |
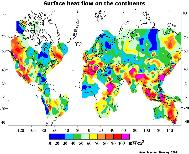
| Surface heat flow |
| Lithospheric thermal thickness versus geologic age |
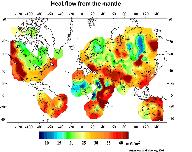
Mantle heat flow
| Temperature at 50 km depth |
| Temperature at 100 km depth |
| Professor Irina M. Artemieva Geology Section, IGN University of Copenhagen Øster Voldgade 10 Copenhagen DK-1350 Denmark Email: iartemieva@gmail.com |
