| Global correlations of seismic elastic and anelastic tomography and mantle temperatures |
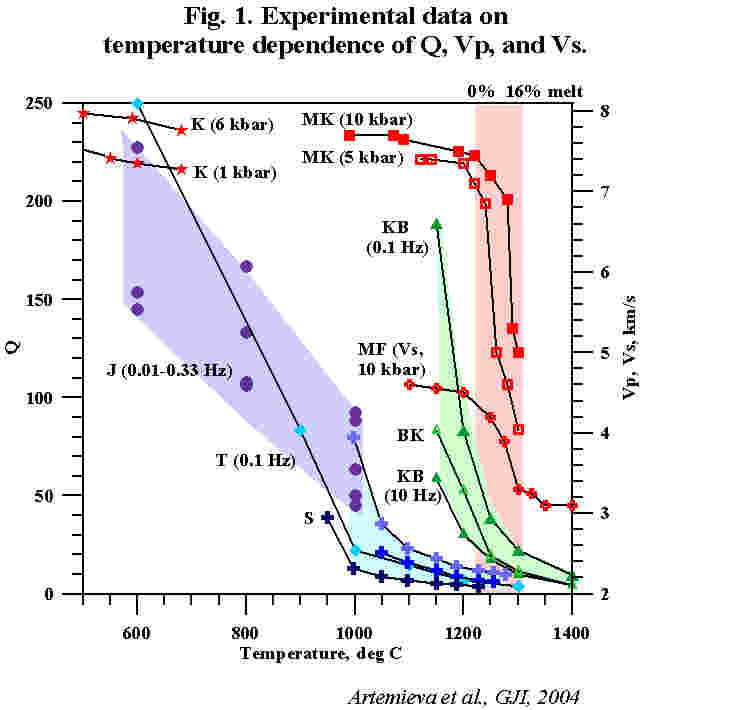
Experimental data on temperature dependence of Q, Vp, and Vs.
|
At high temperatures, the effect of T on Qs and
Vs is different: a sharp increase in Qs occurs at
lower temperature than a drop in Vs associated
with partial melting.
Vs is different: a sharp increase in Qs occurs at
lower temperature than a drop in Vs associated
with partial melting.
Qualitative comparison of Vs, Qs , and T anomalies in the upper mantle


Quantitative comparison of Vs, Qs , and T anomalies in the upper mantle
| Correlation coefficients between seismic velocity, attenuation, temperature, and surface heat flow at different depths in the continental upper mantle |
|
(*) At each depth, values within the band around the average value (zero
anomaly) approximately corresponding to white areas in Figs 2-4, are
excluded from the analysis. The width of the band is 10% of the total range
of parameter variations. The correlations for Vs–Qs and Qs–T at z=50 and
150 km and for Vs–T at z=50 km should be treated with caution due to low
resolution of Vs and Qs models at these depths.
For a comparison, we calculated the correlation between the signs of the
anomalies only ("black & white" models) and excluding the 10%-wide
band around the average value from the statistical analysis. Lower
correlations indicate that the amplitudes of the anomalies are important in
global correlations.
Correlation coefficients calculated when all data were included into the
analysis are presented for a comparison as well.
| Last modified December, 2004; irina@swave.wr.usgs.gov |
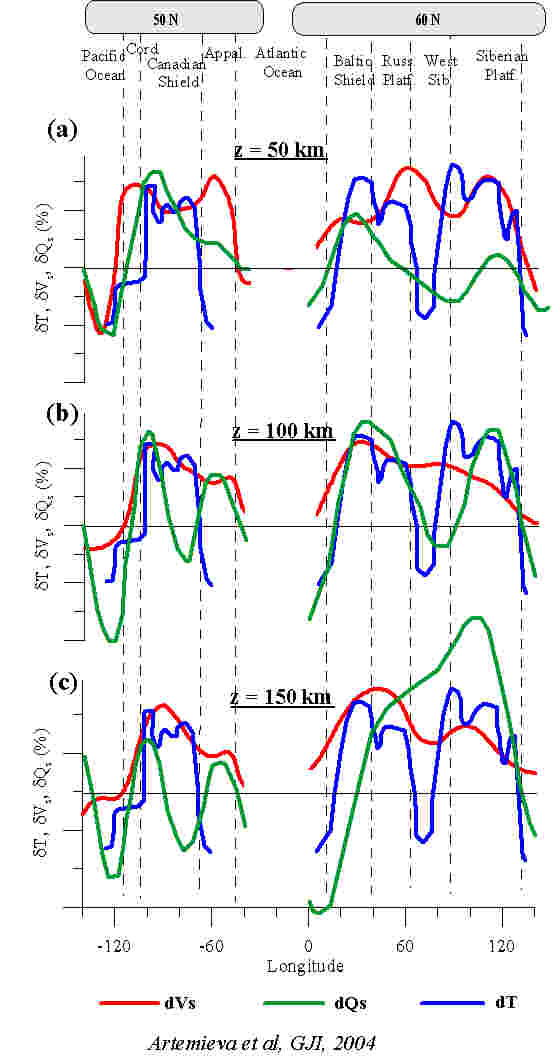
| Comparison of Qs, Vs, and T at a depths of 50, 100, and 150 km along the latitude 50o N in North America and the latitude 60o N in Eurasia. The values of Vs, Qs, and T are averaged over a 10o band, centered correspondingly on 50o N or on 60o N. Large tics of the y-axis correspond to 4% anomaly for Vs, 40% anomaly for Qs, and -20% anomaly for T. Qs and Vs anomalies are shown as variation with respect to PREM. T anomaly is shown with respect to a typical continental geotherm of 55-60 mW/m2 (i.e., ~750o C, ~1000o C, and ~1250o C at three depths, correspondingly). An accuracy in the amplitudes of T model is <10%, so that the signs of the anomalies are the robust features. The lateral resolution of thermal and seismic models is different (ca. 20o for Qs and Vs anomalies and ca. 10o for T anomalies), such that their peaks may not necessarily coincide. The resolution of seismic data is the lowest at 50 km depth due to crustal effects. On the whole, there is a good general agreement between Vs and T anomalies. However, at 100 km depth where the resolution of the attenuation model is the highest, Qs and T anomalies in Eurasia also show an excellent agreement |
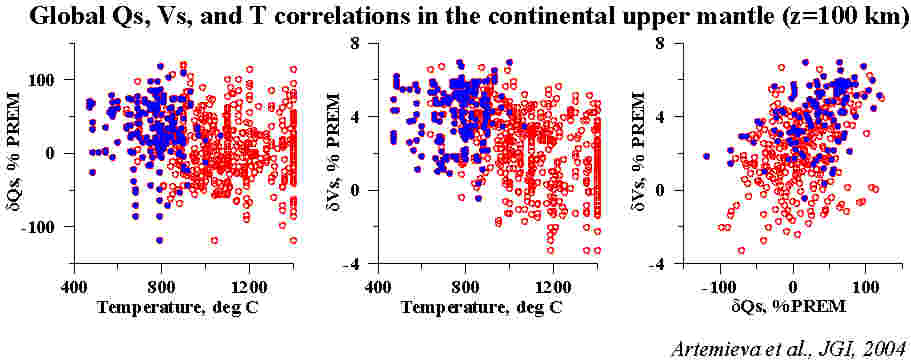
| Correlations between shear-wave velocity Vs (as variation in % relative to PREM), inverse attenuation Qs (as variation in % relative to PREM), and temperature T (in deg C) for continental lithosphere at a depth of 100 km. Vs and Qs values are for the sites of thermal modeling. Red circles – all data for the continents; blue circles – data for Archean – early Proterozoic cratons only. The calculated correlation coefficients are less than 0.42 for any pair of the parameters. The correlation is especially bad for the Archean-early Proterozoic cratons, suggesting that a significant part of lateral Vs and Qs variations in cratonic lithosphere has a non- thermal origin. |
Artemieva I.M., Billien M., Lévêque J.-J., and Mooney W. Geophysical Journal International, 2004, v.157, 607-628. |
| that for the Tibetan Plateau and the Andes, where the crustal thickness exceeds 60-70 km, the anomalies refer to the crustal depth), 100±25 km, and 150±25 km. We visually compare maps of seismic and temperature anomalies in the upper mantle to examine if there is a qualitative regional correlation between the parameters. Since at 50 km depth the crustal structure has the largest influence on the Vs and Qs values, we place greater emphasis on the maps for 100 and 150 km depth, with particular focus on the results for 100 km depth, where the resolution of both of the seismic models is the highest. A comparison of the three maps reveals the existence of a strong overall qualitative correlation between the signs of Vs, Qs, and T anomalies for most of the continental lithosphere at depths of 50-150 km. There are two types of regions where all three anomalies correlate: “cold” regions, which include most of the Precambrian cratons, and “hot” regions such as continental rifts, Cenozoic orogens and, unexpectedly, the Sino-Korean craton. The signs of all three anomalies correlate within both of the groups throughout the entire lithosphere, which suggests a primarily thermal origin of most of the seismic anomalies. |

- THE CONTINENTAL LITHOSPHERE
| |
| |
| |
| |
| |
| |
| |
| |
| |
| |
- THE CONTINENTAL LITHOSPHERE
