| Which part of seismic Qs and Vs anomalies cannot be predicted from mantle temperatures alone ? |
Using laboratory data on the temperature dependence of Vs and Qs in
olivine-rich rocks, we calculate theoretical Qs(T) and Vs(T) at z=100
km from known temperatures. A comparison of observed and theoretical
values provides an estimate of a part of seismic anomalies that cannot be
predicted from temperature variations alone. In ca. 50% of the
continents seismic attenuation and velocity anomalies can be explained
by thermal effects alone (white areas). However, these regions do not
show any systematic correlation either with the tectonic setting, nor with
geological age.
Regions with positive δQs and δVs anomalies include mostly cratons, for
which we favor compositional origin of seismic anomalies.
Qs<Qs(T) and Vs<Vs(T) anomalies are observed chiefly in
tectonically active regions with high mantle temperatures, where
presence of partial melts/ fluids may be the cause of very low Vs and
Qs values. However, with few exceptions, regions with Qs<Qs(T)
and Vs<Vs(T) anomalies do not overlap, suggesting that no single
mechanism gives rise to these anomalies.
Several Phanerozoic regions have positive δQs and δVs anomalies,
with δVs~3% being too large (ca. 50-70% of Vs anomalies) to be
explained by overestimated temperatures. We propose that these δQs
and δVs anomalies have a compositional origin and can be associated
with ancient subduction zones.
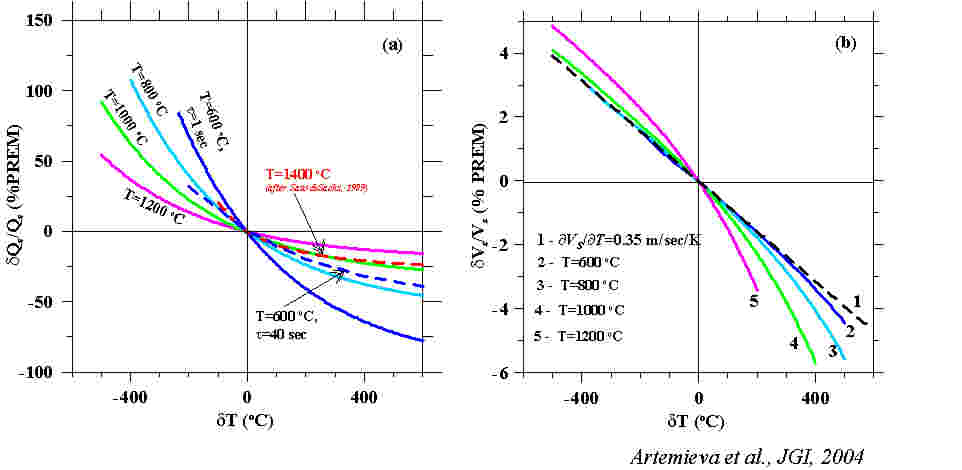
| This plot illustrates how δQs and δVs anomalies can be interpreted in terms of temperature variations in the mantle. |
| Tectonic interpretations of δQs and δVs anomalies |
Tectonically active regions: (Summary Table)
Negative δQs and δVs anomalies could have been explained by higher
mantle temperatures. However since the assumed T values are already
close to the mantle adiabat, we conclude that a presence of partial melt
and/or fluids in the uppermost mantle is required to explain seismic Vs
and Qs. In particular, in active regions partial melts/volatiles may be
responsible for δVs anomalies of ~3% (i.e. >50-70% of total observed
Vs anomalies).
Precambrian terranes: (Summary Table)
There is a striking similarity between the regions with Qs >QsT and Vs
>VsT anomalies, which mostly include Precambrian terranes. Possible
explanations for positive δQs and δVs anomalies include overestimated
lithospheric temperatures and/or unusually dry conditions within the
cratonic lithosphere and/or compositional anomalies. It is surprising that
the misfit δVs between theoretical and seismic Vs is the same in all
cratonic regions, ca. 1-2%. It can be explained by ca. 70-150o C lower
temperatures at z=100 km than in the T model. Alternatively, a typical
difference in mg# (MgO/[MgO+FeO]) between the Archean and the
Phanerozoic lithosphere (0.93 and 0.89, correspondingly, e.g. Griffin et
al. 1999) also produces a ca. 1% velocity anomaly (Deschamps et al.
2002). The remaining δVs<1% is within the accuracy of the
temperature model. Since it is more uncertain to quantify δT required to
explain a δQs misfit, and the effect of depletion on attenuation is not
well known, we are inclined to conclude that δQs and δVs anomalies in
the cratonic lithosphere are of a compositional origin (e.g. depletion in
basaltic components).
Paleosubduction zones:
Several Phanerozoic regions have positive δQs and δVs anomalies, with
δVs~3% being too large (ca. 50-70% of Vs anomalies) to be explained
by overestimated temperatures. We propose that these δQs and δVs
anomalies have a compositional origin and can be associated with
ancient subduction zones (central Europe, southern USA, Himalayas and
the Tethys belt) or have other unknown non-thermal origin (West
Siberian Basin).
| Last modified December, 2004; irina@swave.wr.usgs.gov |
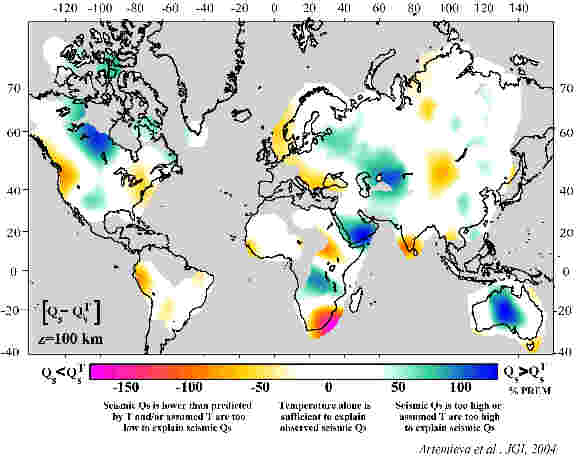
| Map of the difference δQs between (1) Qs at 100 km depth as calculated from surface waves (Billien et al. 2000) and (2) the value of Qs(T) estimated from experimental data of Jackson et al (1992) for τ=40 sec and the lithospheric temperatures (Artemieva & Mooney, 2001). A large part of the continental lithosphere with diverse ages and tectonic settings fits a purely thermal model for seismic Qs (white areas). Many active regions appear as more attenuating (δQs<0), probably due to the presence of fluids and partial melts. The anomalies over South Africa and India can be produced by smearing of strong offshore attenuation anomalies. Qs anomalies in some cratonic regions (central Australia and the Canadian Shield) are higher than predicted by Qs(T) models (δQs>0), suggesting that lithospheric temperatures can be somewhat lower than suggested thermal model. Alternative explanation includes scattering on large-scale structural heterogeneities in the cratonic lithosphere, which was formed by collisions of numerous continental and oceanic terranes. Qs anomalies over the South African and Indian cratons are smearing artifacts of strong off-shore seismic attenuation anomalies. |
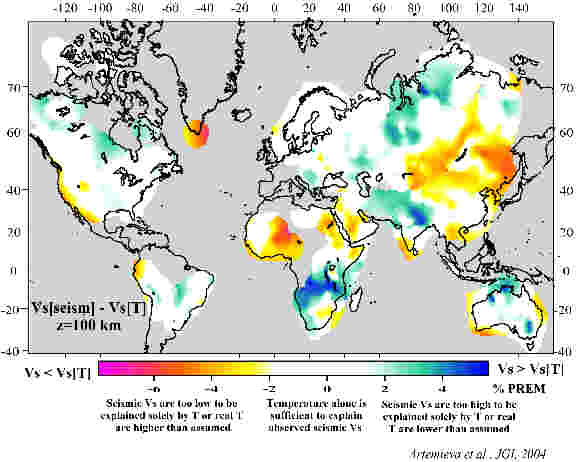
| Map of the difference δVs between (1) Vs at 100 km depth as calculated from surface waves (Billien, 1999) and (2) the value of Vs (T) estimated from the lithospheric temperatures (Artemieva & Mooney, 2001) with account for anelasticity, for τ=40 sec. Only small areas of the continental lithosphere fit a purely thermal model for seismic Vs (white areas). In many active regions δVs is ca. -3% (which corresponds to ca. 50-70% of the total Vs anomaly), probably due to the presence of fluids and partial melts. Positive δVs anomalies in most of the cratonic regions can be explained by Fe-depletion of lithospheric keels. Several Phanerozoic regions have δVs too large (~3%) to be explained by overestimated T, these regions seem to be associated with past and present subduction zones. |
| Relative anomalies of Qs (a) and Vs (b) as a function of T anomalies for different upper mantle temperatures. (a) Solid lines - δQs anomalies based on experimental data of Jackson et al (1992) for frequency τ=1 sec. For a comparison, the results for T=600o C are also presented for τ=40 sec (dashed line). Dashed red line - δQs calculated for high homologous mantle T (i.e. T/Tm, where Tm is solidus temperature) based on experimental data of Sato & Sacks (1989). (b) Solid lines - δVs anomalies with account for anelasticity, for τ=40 sec. For a comparison, dashed line - δVs based on a linear relationship dVs/dT=0. 35 m/sec/K (Sumino & Anderson 1982). |
Artemieva I.M., Billien M., Lévêque J.-J., and Mooney W. Geophysical Journal International, 2004, v.157, 607-628. |

Irina Artemieva: Research highlights
- THE CONTINENTAL LITHOSPHERE
| |
| |
| |
| |
| |
| |
| |
| |
| |
| |
- THE CONTINENTAL LITHOSPHERE
