
| Last modified December, 2013; irina@ign.ku.dk |
Thermo-chemical heterogeneity from seismic tomography
THE LITHOSPHERE
| The site is being updated irregularly |
Number of page visits
|
| Global correlations of seismic elastic and anelastic tomography and mantle temperatures |
Artemieva I.M., Billien M., Lévêque J.-J., and Mooney W. Geophys. J. Intern., 2004, v.157, 607-628. |
Seismic velocity and attenuation anomalies in the mantle are commonly interpreted in terms of temperature variations on the
compare global maps of the thermal structure of the continental upper mantle with global 1/Qs and Vs maps as determined
from Rayleigh waves at periods between 40 and 150 sec. We limit the comparison to three continental mantle depths (50,
100, and 150 km), where model resolution is relatively high.
The available data set does not indicate that, at a global scale, anomalies in the upper mantle are controlled solely
by temperature variations. Continental maps have correlation coefficients of <0.56 between Vs and T and of <0.47
between Qs and T at any depth. Such low correlation coefficients can partially be attributed to modeling artifacts;
however, they also suggest that not all of Vs and Qs anomalies in the continental upper mantle can be explained by T
variations.
Global maps show that, by the sign of the anomaly, Vs and Qs usually inversely correlate with lithospheric temperatures:
most cratonic regions show high Vs and Qs and low T, while most of active regions have seismic and thermal anomalies of
the opposite sign. The strongest inverse correlation is found at a depth of 100 km, where the attenuation model is best
resolved. Significantly, at this depth, the contours of near-zero Qs anomalies approximately correspond to the 1000o C
isotherm, in agreement with laboratory measurements that show a pronounced increase in seismic attenuation in upper
mantle rocks at 1000o-1100o C. East-west profiles of Vs, Qs, and T where continental data coverage is best (50o N
latitude for North America and 60o N latitude for Eurasia) further demonstrate that temperature plays a dominant, but
non-unique, role in determining the value of lithospheric Vs and Qs.
At 100 km depth, where the resolution of seismic models is the highest, we compare observed seismic Vs and Qs with
theoretical Vs(T) and Qs(T) values that are calculated solely from temperature anomalies and constrained by experimental
data on temperature dependences of velocity and attenuation. This comparison shows that temperature variations alone are
sufficient to explain seismic Vs and Qs in ca. 50% of continental regions. We hypothesize that compositional anomalies due
to Fe-depletion can explain the misfit between seismic and theoretical Vs in cratonic lithosphere. In regions of active
tectonics, temperature effects alone cannot explain seismic Vs and Qs in the lithosphere. It is likely that partial melts and/or
fluids may affect seismic parameters in these regions.
This study demonstrates that lithospheric temperature plays the dominant role in controlling Vs and Qs anomalies, but other
physical parameters, such as compositional variations, fluids, partial melting, and scattering may also play a significant role
in determining Vs and Qs variations in the continental mantle.
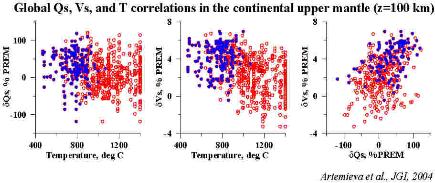
Correlations between shear-wave velocity Vs (as variation in % relative to PREM), inverse attenuation Qs (as variation in % relative to PREM), and temperature T (in deg C) for continental lithosphere at of thermal modeling. Red circles – all data for the continents; blue circles – data for Archean – early Proterozoic cratons only. The calculated correlation coefficients are less than 0.42 for any pair of the parameters. The correlation is especially bad for the Archean-early Proterozoic cratons, suggesting that a significant part of lateral Vs and Qs variations in cratonic lithosphere has a non-thermal origin. |
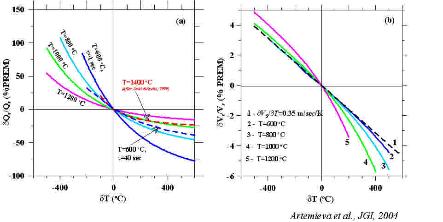
| This plot illustrates how δQs and δVs anomalies can be interpreted in terms of temperature variations in the mantle. |
| Relative anomalies of Qs (a) and Vs (b) as a function of T anomalies for different upper mantle temperatures. (a) Solid lines - δQs anomalies based on experimental data of Jackson et al (1992) for frequency τ=1 sec. For a comparison, the results for T=600o C are also presented for τ=40 sec (dashed line). Dashed red line - δQs calculated for high homologous mantle T (i.e. T/Tm, where Tm is solidus temperature) based on experimental data of Sato & Sacks (1989). (b) Solid lines - δVs anomalies with account for anelasticity, for τ=40 sec. For a comparison, dashed line - δVs based on a linear relationship dVs/dT=0.35 m/sec/K (Sumino & Anderson 1982) |
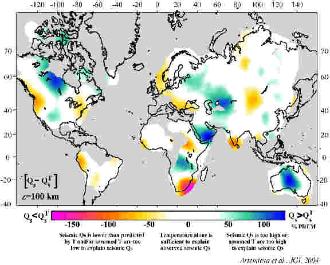
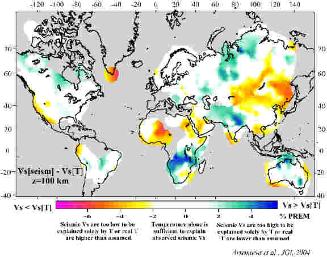
| Which part of seismic Qs and Vs anomalies cannot be predicted from mantle temperatures alone ? |
| Map of the difference δQs between (1) Qs at 100 km depth as calculated from surface waves (Billien et al. 2000) and (2) the value of Qs(T) estimated from experimental data of Jackson et al (1992) for τ=40 sec and the lithospheric temperatures (Artemieva & Mooney, 2001). |
| Map of the difference δVs between (1) Vs at 100 km depth as calculated from lithospheric temperatures (Artemieva & Mooney, 2001) with account for anelasticity, for τ=40 sec. |
Using laboratory data on the temperature dependence of Vs and Qs in olivine-rich rocks, we calculate theoretical Qs(T) and Vs(T) at z=100 km
from known temperatures. A comparison of observed and theoretical values provides an estimate of a part of seismic anomalies that cannot be
predicted from temperature variations alone. In ca. 50% of the continents seismic attenuation and velocity anomalies can be explained by
thermal effects alone (white areas). However, these regions do not show any systematic correlation either with the tectonic setting, nor with
geological age.
| Professor Irina M. Artemieva Geology Section, IGN University of Copenhagen Øster Voldgade 10 Copenhagen DK-1350 Denmark Email: iartemieva@gmail.com |


