
| Last modified 06/2019 |
Regional crustal models
THE LITHOSPHERE
| The site is being updated irregularly |
Number of page visits
|
- Europe, Greenland, North Atlantics;
- Siberian craton and West Siberian basin;
- North China craton;
- Arctics;
- cratons of southern Africa
1. Regional crustal model for Europe, Greenland, and the North Atlantics region (EUNAseis)
2. Regional crustal model for Siberia (SibCrust)
3. Regional crustal model for the North China craton (NCcrust)
- SibCrust is a new digital crustal model for Moho depth and crustal structure in the
- SibCrust model includes both Vp velocity and thickness of five crustal layers,
including:
- the sedimentary cover,
- the upper crust,
- the middle crust,
- the lower crust,
- the high-Vp lowermost crust,
- and the upper mantle Pn velocity.
- Our compilation is based on digitization of all seismic profiles published since 1960
and sampled with a nominal interval of 50 km, which provides a dense regional data
coverage. - Data quality has been assessed and quantitatively assigned to each profile based
on acquisition and interpretation method and completeness of crustal model. - The database represents major improvement in coverage and resolution and
includes depth to Moho, thickness and average P-wave velocity of five crustal
layers and Pn velocity. - Exclusion of non-seismic data allows application of the database to potential field
modeling.
| Cherepanova Yu., Artemieva I.M., Thybo H., Chemia Z., 2013. Crustal structure of the Siberian Craton and the West Siberian Basin: An appraisal of existing seismic data. Tectonophysics, 609, 154-183 |
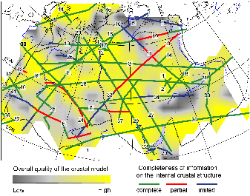
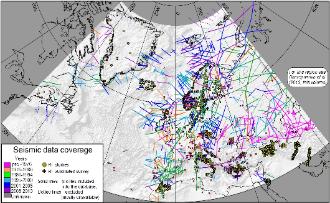
Data coverage and quality of seismic models
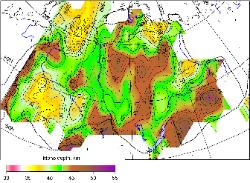
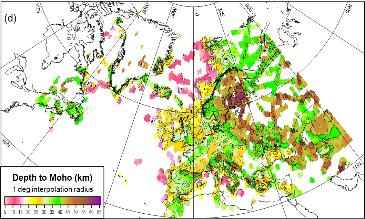
Depth to Moho
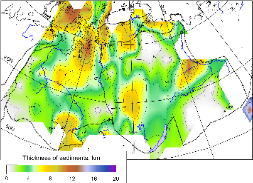
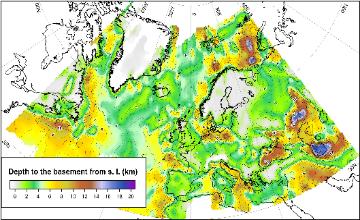
Thickness of sediments
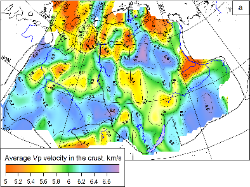
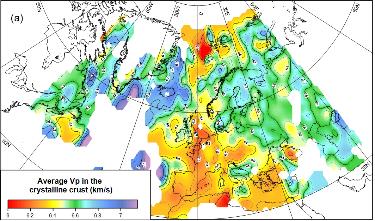
Average Vp in the crust (basement and sediments)
| Artemieva I.M. and Thybo H., 2013. EUNAseis: a seismic model for Moho and crustal structure in Europe, Greenland, and the North Atlantic region. Tectonophysics, 609, 97-153 |
- EUNAseis is a new digital crustal model for Moho depth and crustal
structure in Europe, Greenland, Iceland, Svalbard, European Arctic
shelf, and the North Atlantic Ocean (72W–62E, 30N–84N).
- EUNAseis model includes both Vp velocity and thickness of five
crustal layers, including:
- the sedimentary cover,
- the upper crust,
- the middle crust,
- the lower crust,
- the high-Vp lowermost crust,
- and the upper mantle Pn velocity.
- Our compilation is based on digitization of original seismic profiles
and Receiver Functions from ca. 650 publications which provides a
dense regional data coverage. - Exclusion of non-seismic data allows application of the database to
potential field modeling.
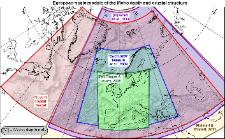
| Comparison of existing crustal models for the European region (link to technical details) |
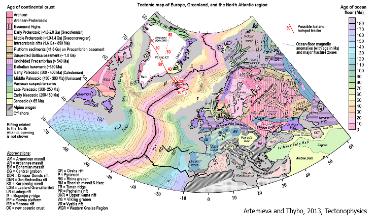
New tectonic map of Europe
Data coverage and quality of seismic models
Depth to Moho
Thickness of sediments
| Professor Irina M. Artemieva Geology Section, IGN University of Copenhagen Øster Voldgade 10 Copenhagen DK-1350 Denmark Email: iartemieva@gmail.com |
5. Regional crustal model for southern Africa based on RF (SASE data)
4. Regional crustal model for the Arctic ocean
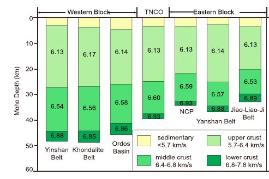
| Xia B., Thybo H., Artemieva I.M., 2017. Seismic crustal structure of the North China Craton and surrounding area: Synthesis and analysis JGR, 122, doi:10.1002/2016JB013848. |
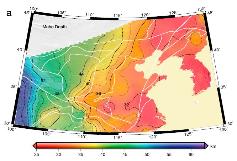
Depth to Moho
Data coverage and quality of seismic models
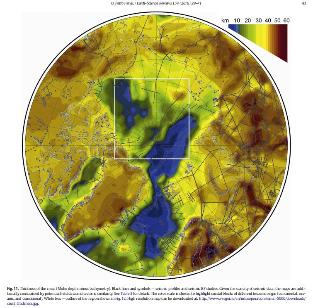
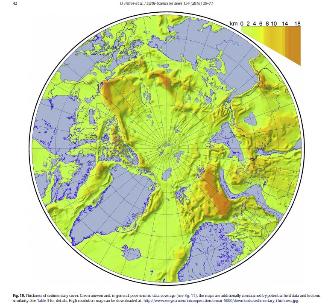
| Petrov et al., 2016. Crustal structure and tectonic model of the Arctic region Earth-Science Reviews 154 (2016) 29–71 |
LEFT: Thickness of sedimentary cover.
High resolution map can be downloaded at: http://www.vsegei.ru/en/intcooperation/temar-5000/downloads/sedimentary_thichness.
jpg.
RIGHT: Thickness of the crust (Moho depth minus bathymetry).
Black lines and symbols — seismic profiles and seismic RF studies. Given the scarcity of seismic data, the maps are additionally
constrained by potential field data and tectonic similarity. The color scale is chosen to highlight crustal blocks of different tectonic
origin (continental, oceanic, and transitional).
High resolution map can be downloaded at: http://www.vsegei.ru/en/intcooperation/temar-5000/downloads/crust_thichness.jpg
| M. Youssof , H. Thybo, I.M. Artemieva, A. Levander, 2013 Moho depth and crustal composition in Southern Africa Tectonophysics 609 (2013) 267–287 |
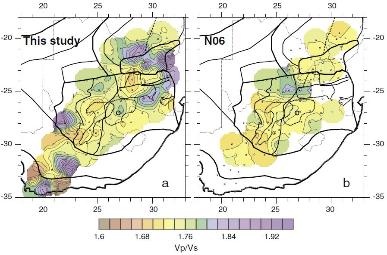
Average crustal Vp/Vs ratio based on RFs analysis:
(a) present study for the entire SASE array; and (b) model
of Nair et al. (2006) for 44 stations
(a) present study for the entire SASE array; and (b) model
of Nair et al. (2006) for 44 stations
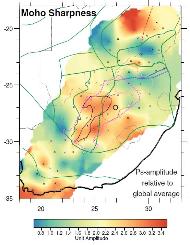
Map illustrating the sharpness of the
Moho transition determined as the
amplitude of the Pds phases relative to
the average Pds amplitude in the study
area. Large values correspond to a
sharp Moho transition (a strong
converter).
Moho transition determined as the
amplitude of the Pds phases relative to
the average Pds amplitude in the study
area. Large values correspond to a
sharp Moho transition (a strong
converter).
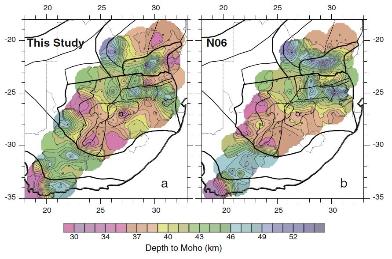
Moho depth in southern Africa based on SASE array data.
(a) This study based on P-RF, the corresponding Vp/Vs values
are shown in Fig. 9a; (b) P-RFmodel of Nair et al. (2006), the
correspondingmodelled Vp/Vs values are shown in Fig. 9b for
44 stations
(a) This study based on P-RF, the corresponding Vp/Vs values
are shown in Fig. 9a; (b) P-RFmodel of Nair et al. (2006), the
correspondingmodelled Vp/Vs values are shown in Fig. 9b for
44 stations

