

| Last modified 06/2019 |
Mantle compositional heterogeneity
| |
| |
| |
| |
| |
| |
| |
| |
| |
| |
| |
| |
| |
| |
| |
| |
THE LITHOSPHERE
| The site is being updated irregularly |
Number of page visits
|


| Thermo-chemical heterogeneity of the Siberian mantle lithosphere: density structure and kimberlites |
| |
| |
| |
| |
| |
| |
| |
| |
| |
| |
| |
| |
| |
| |
| |
| |
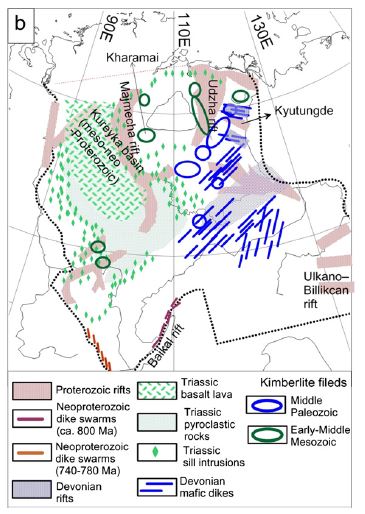
Major magmatic events in Siberia
(Cherepanova & Artemieva, 2015)
(Cherepanova & Artemieva, 2015)
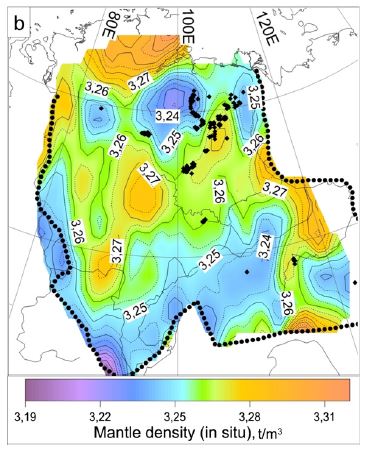
In situ lithosphere mantle density. Black dots -
kimberlites. Kimberlites do not sample most
depleted mantle, and isopycnicity is satisfied only
in kimberlite regions
(Cherepanova & Artemieva, 2015; Artemieva et al.,
2019)
kimberlites. Kimberlites do not sample most
depleted mantle, and isopycnicity is satisfied only
in kimberlite regions
(Cherepanova & Artemieva, 2015; Artemieva et al.,
2019)
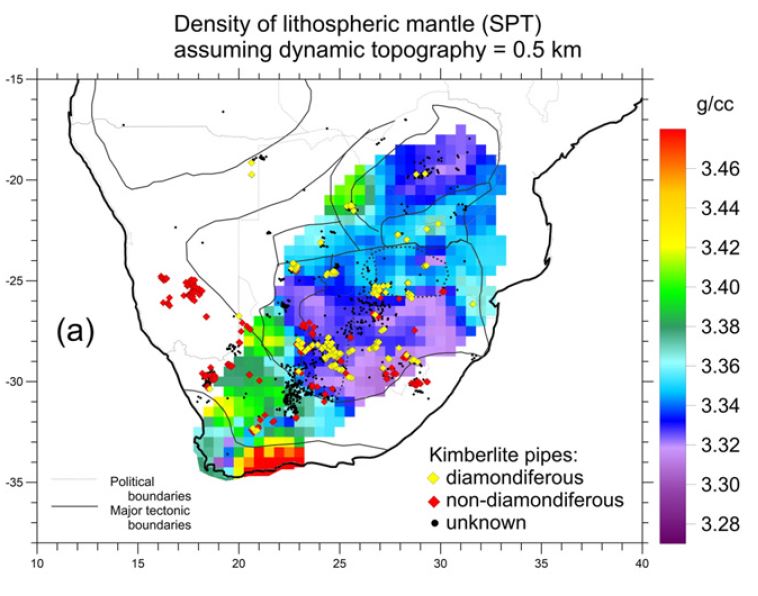
Thermo-chemical heterogeneity of mantle lithosphere in southern Africa:
mantle density structure, Moho sharpness, dynamic topography, kimberlites
mantle density structure, Moho sharpness, dynamic topography, kimberlites
Mantle density at room P-T conditions
(Artemieva & Vinnik, 2016)
(Artemieva & Vinnik, 2016)
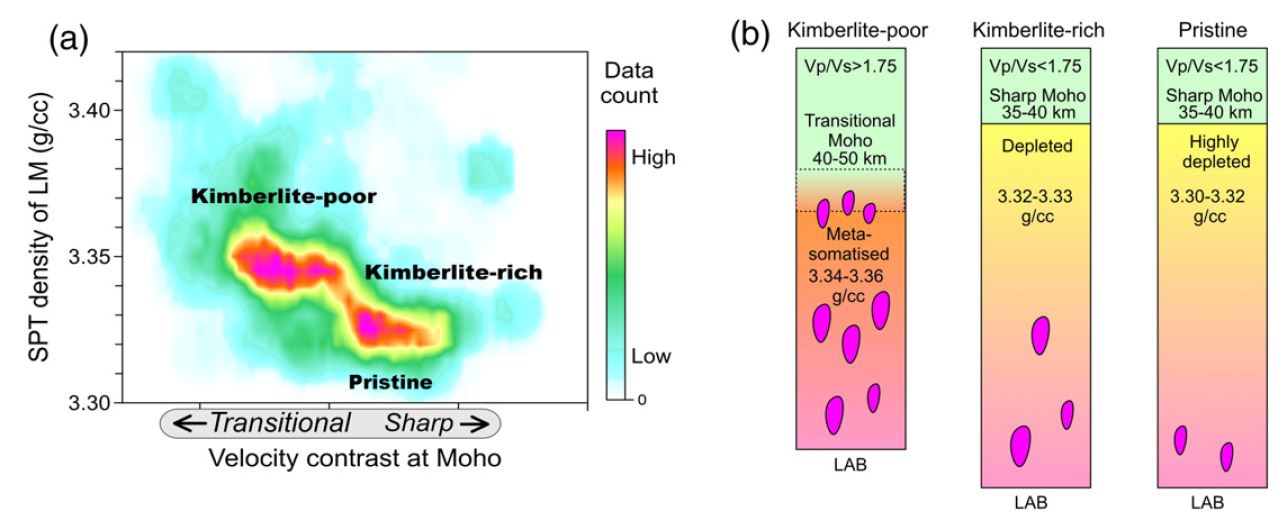
mantle (the case of 0.5 km dynamic topography); colors show density distribution of data points
calculated on a 30 × 30 min grid. Data cluster with the transitional velocity contrast at the Moho and
lithospheric mantle density of around 3.35 g/cm3 corresponds to kimberlite-poor cells, while data cluster
with a sharp Moho and lithospheric mantle density of 3.32–3.33 g/cm3 corresponds to kimberlite-rich
cells. “Pristine” mantle with low values of LM density and sharp Moho lacks kimberlites.
(b) Conceptual model showing links between depth to the Moho, Moho sharpness, crustal Vp/Vs, mantle
density, lithosphere thickness, and kimberlite occurrences.
(Artemieva & Vinnik, 2016)
| Thermo-chemical heterogeneity of mantle lithosphere from temperature-corrected seismic tomography models |
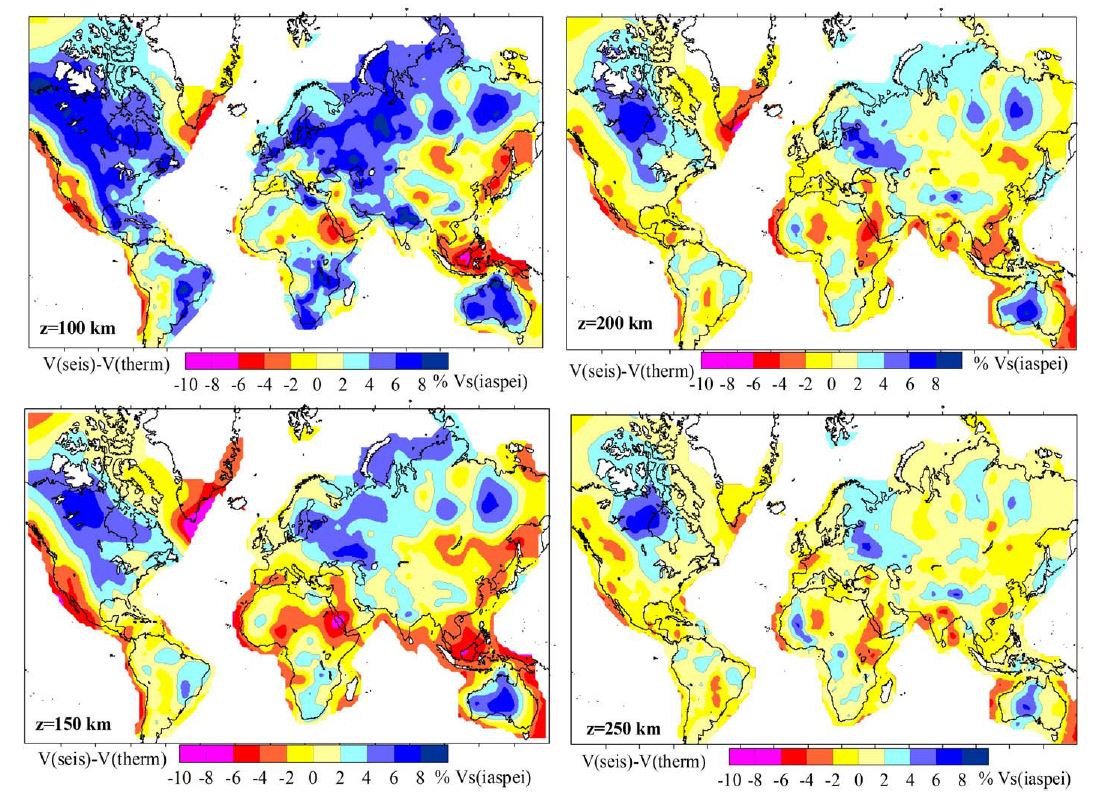
Compositional (non-thermal) seismic velocity
variations in the lithospheric mantle at depths of 100
difference between the observed seismic velocities
(based on the surface-wave tomography model of
Shapiro and Ritzwoller, 2002) and seismic velocity
variations caused by temperature deflection from a
typical continental geotherm of 50–55 mW/m2.
(Artemieva, 2009)
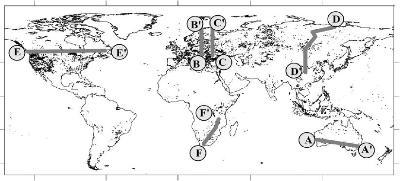
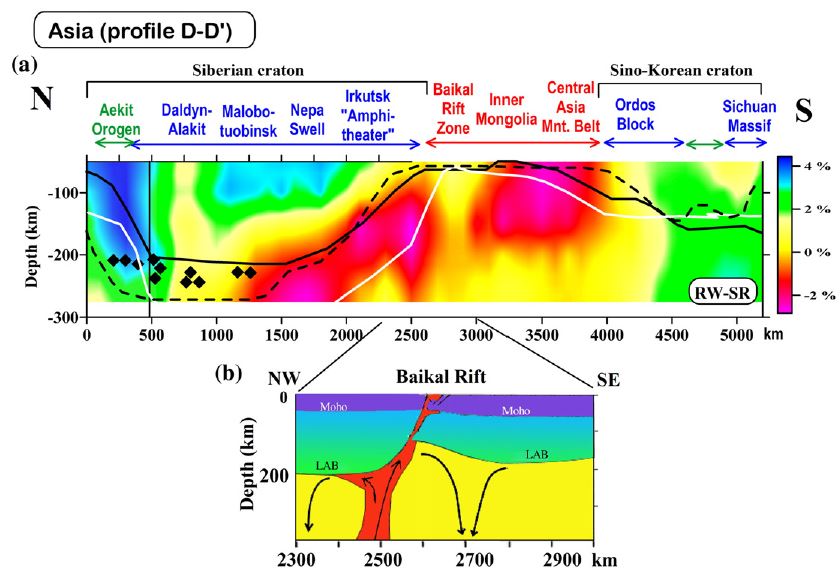
(a) Compositional (non-thermal) seismic velocity variations
in the lithospheric mantle across Asia (profile D–D′ in Fig.
tomography model of Shapiro and Ritzwoller, 2002.
tomography model of Shapiro and Ritzwoller, 2002.
Notations as in Fig. 9. Diamonds–kimberlite locations in a 5
deg-wide corridor along the profile (Faure, 2006). White
shading at the left (the Aekit orogen): region where seismic
and thermal estimates of the lithospheric thickness are
significantly different (due to poor ray path coverage,
uncertain crustal structure, and scarce borehole data,
compare with Fig. 8), leading to an ambiguity in
interpretation of compositional velocity anomalies.
and the adjacent provinces (modified after Petit et al.,
1998). The model suggests that the mantle anomaly is
located beneath the Siberian craton and the rising hot
material follows the bottom of the cratonic lithosphere and
is guided underneath the Baikal Rift by the edge of the
craton.
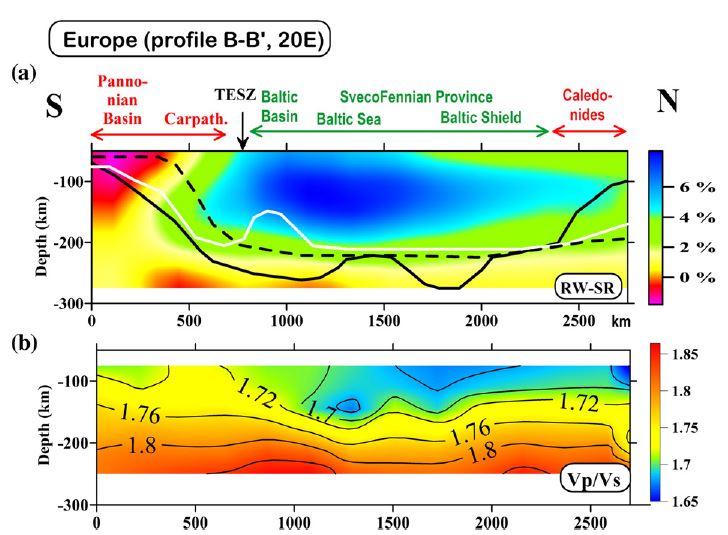
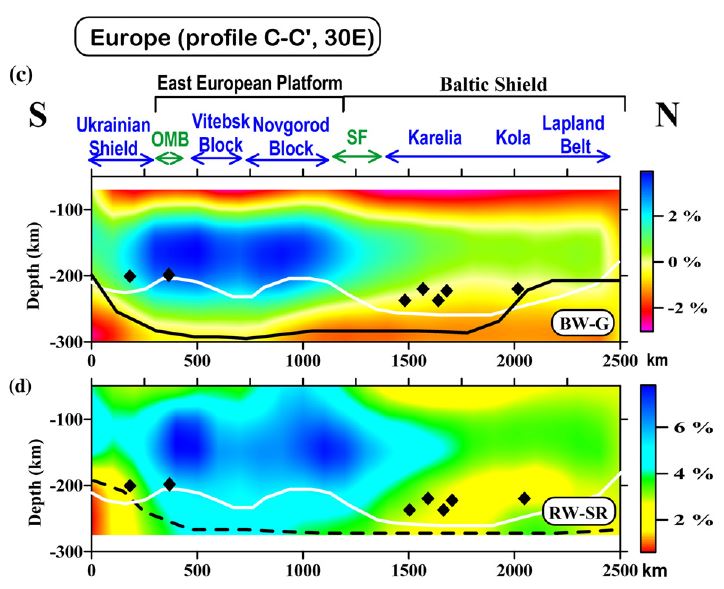
Compositional (non-thermal) seismic velocity variations in the lithospheric mantle across Europe:
(a) along 20E (profile B–B′ in Fig. 8), (c) and (d) along 30E (profile C–C′).
(b) and (e) Vp/Vs ratio along the profiles (after Artemieva, 2007).
Note that kimberlite region in the Baltic shield has a significantly modified (metasomatised) composition
of the lithosphere mantle as compared to regions not sampled by kimberlites.
P-wave velocity is based on the regional model of Bijwaard and Spakman (2000); S-wave velocity is
based on the model of Shapiro and Ritzwoller (2002). Seismic velocities (a), (c), (d) are based on the
surface-wave tomography model of Shapiro and Ritzwoller, 2002 (a, d) and on the body-wave
tomography model of Grand, 2002 (c).
Black lines — lithospheric base as defined by a 2% δVs anomaly with respect to ak135 (Kennett et al.,
1995) in the BW–G (solid lines) and RW–SR (dashed lines) tomography models; white lines — base of
thermal lithosphere (defined by 1300 °C isotherm). Due to significantly different amplitudes of velocity
anomalies in the BW–G and RW–SR seismic models, associated with different wave propagation in
surface-wave and body-wave tomography, the results permit only a relative comparison of the
compositional velocity anomalies, but not their absolute values (to facilitate the comparison, the color
scales for two tomography models are shifted).
Abbreviations: OMB — Osninsk-Mikashevichi Igneous Belt; SF — SvecoFennian Province.
Diamonds — kimberlite locations in a 5-deg wide corridor along the profiles (Faure, 2006).
| Professor Irina M. Artemieva Geology Section, IGN University of Copenhagen Øster Voldgade 10 Copenhagen DK-1350 Denmark Email: iartemieva@gmail.com |
| Artemieva I. & Vinnik L., 2016. Gondwana Research, v. 36, 14-27; v. 39, 204-206 |
| Artemieva I.M., 2009. Lithos, v. 109, 23-46 |
| Cherepanova Y. & Artemieva I., 2015. Gondwana Research, v. 28, 1344-1360 |