
| Last modified December, 2013; irina@ign.ku.dk |
Crustal structure and Moho depth
THE LITHOSPHERE
| The site is being updated irergularly |
Number of page visits
|
My studies of the crustal structure focus on:
- regional crustal models,
- mechanisms that control the depth to Moho,
- and mechanisms of crustal underplating.
1. Crustal underplating
2. Mechanisms that control the depth to Moho
(with a case study of crust-mantle interaction in Europe)
(with a case study of crust-mantle interaction in Europe)
Underplating was originally proposed as the process of magma ponding at the base of the crust and was inferred from density
material to the upper parts of the crust by magma fractionation during cooling and solidification in the lower crust. its
characteristic low average density, also during the early evolution of the Earth.
Despite the assumed importance of underplating processes and associated fractionation, the available geophysical images of
underplated material remain relatively sparse and confined to specific tectonic environments. Direct ponding of magma at the
Moho is only observed in very few locations, probably because magma usually interacts with the surrounding crustal rocks which
leads to smearing of geophysical signals from the underplated material. In terms of processes, there is no direct discriminator
between the traditional concept of underplated material and lower crustal magmatic intrusions in the form of batholiths and
sill-like features, and in the current review we consider both these phenomena as underplating.
In this broad sense, underplating is observed in a variety of tectonic settings, including island arcs,wide extensional continental
areas, rift zones, continental margins and palaeo-suture zones in Precambrian crust. We review the structural styles of magma
underplating as observed by seismic imaging and discuss these first order observations in relation to the Moho.
| Thybo H. and Artemieva I.M., 2013. Moho and magmatic underplating in continental lithosphere. Tectonophysics, 609, 605-619 |
| Artemieva I.M. and Meissner R., 2012. Crustal thickness controlled by plate tectonics: a review of crust-mantle interaction processes illustrated by European examples. Tectonophysics, v. 530-531, 18–49 |
| Click on figures to enlarge images |
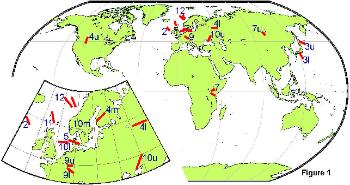
| Location map for discussed seismic profiles |
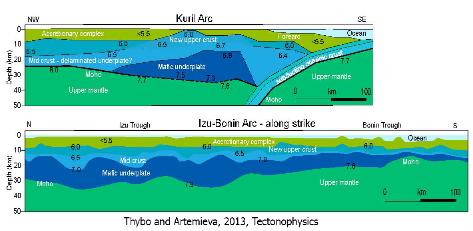
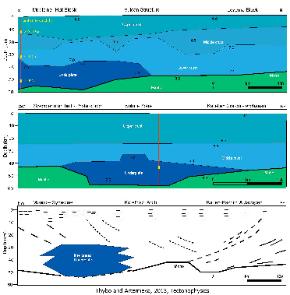
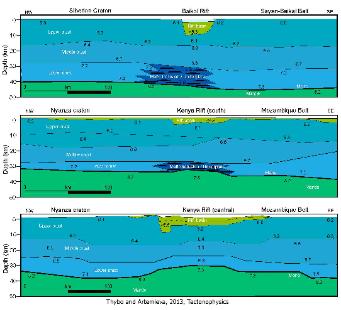
| Examples of underplating (dark blue) in different tectonic settings. See paper for references. Top: within the cratons (Wyoming, Baltic Shield, and Volga-Uralia) Left: in rift zones (Baikal, and 2 examples from Kenya) Bottom: across the Kuril arc and along the Izu-Bonin arc. |
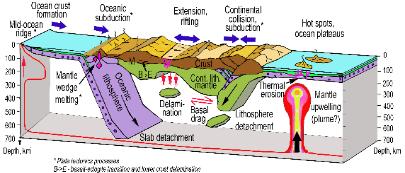
We review geophysical and geochemical aspects of global crust-mantle material exchange processes and examine the processes which, on one side, form and
transform the continental crust and, on the other side, chemically modify the mantle residue from which the continental crust has been extracted. Major mechanisms that
provide crust-mantle material exchange are oceanic and continental subduction, lithosphere delamination, and mafic magmatism. While both subduction and
delamination recycle crustal material into the mantle, mafic magmatism transports mantle material upward and participates in growth of new oceanic and continental
We discuss the role of basalt/gabbro-eclogite phase transition in crustal evolution and the links between lithosphere recycling, mafic magmatism, and crustal
underplating. We advocate that plate tectonics processes, together with basalt/gabbro-eclogite transition, limit crustal thickness worldwide by providing effective
mechanisms of crustal (lithosphere) recycling.
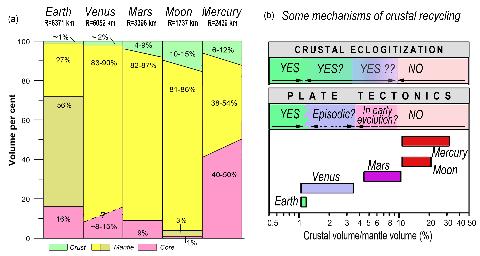
| Sketch of the internal structure of the terrestrial bodies and the relative volume of the crust, mantle and core as percent of the total volume of the bodies. |
| Plate tectonics processes may have a strong control on the crustal thickness. |
| Sketch of major processes controlling crust-mantle material exchange. Vertical and horizontal dimensions are not to scale |
The processes of crust-mantle interaction have created very dissimilar crustal styles in Europe, as seen by its seismic structure, crustal
thickness, and average seismic velocities in the basement. Our special focus is on processes responsible for the formation of the thin crust of
central and western Europe, which was largely formed during the Variscan (430-280 Ma) orogeny but has the present structure of an “extended”
crust, similar to that of the Basin and Range province in western USA. Major geophysical characteristics of the Variscan lithosphere are
discussed within the frame of possible sequences of crust-mantle material exchange mechanisms during and after main orogenic events in the
European Variscides.
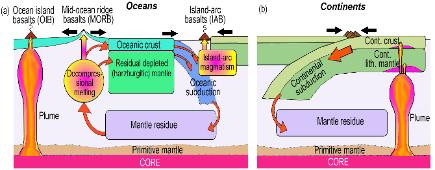
| continental crust. Melting of the depleted convecting upper mantle generates mid-ocean ridge basalts and produces oceanic crust. A significant amount of the oceanic crust together with the associated residual depleted mantle is recycled back in subduction zones refertilizing the mantle and producing island-arc magmatism which plays an important role in formation of the continental crust. The enriched upper mantle is the source of ocean-island basalts. Large-scale mantle upwellings (plumes) as well as small-scale convective instabilities (not shown) transport mantle material into the continental lithosphere and lead to crustal growth, particularly notable in LIPs. Vertical and horizontal dimensions are not to scale. |
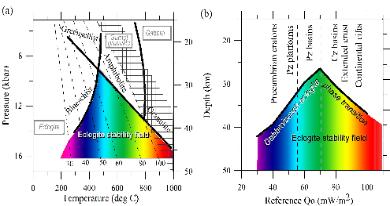
Gabbro/basalt – eclogite phase transitions in the crustal rocks. Rainbow shading – eclogite stability field, colors refer to lithospheric temperatures (purple for cold, red for hot). Pressure-depth conversion is made assuming crustal density of 2.90 g/cm3. (a) Bold black lines - phase diagram (after Spear, 1993). Shaded area and gray boxes - extrapolated stability fields of eclogite, garnet granulite, and pyroxene granulite-gabbro based on experimental data for the quartz tholeiite composition (Ringwood and Green, 1966). Thin dashed lines – typical continental reference mW/m2. (b) Depth to gabbro/basalt – eclogite phase transition (thick gray line) in different continental settings plotted versus continental reference geotherms labeled in heat flow values (after Artemieva, 2011). Tectonic provinces are marked on the top in accordance with typical heat flow values. Gabbro/basalt – eclogite phase transition limits crustal thickness to 40-45 km in cold stable platforms and to ~30 km in Phanerozoic basins. |
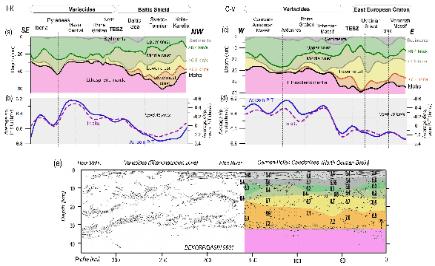
seismic data averaged within 600 km-wide corridors along the profiles. Upper plots (a, c) show the subdivision of the lithosphere into compositional layers as based on P-wave seismic velocities (Mengel et al., 1991; Wedepohl, 1995): granites and gneisses (upper crust) Vp<6.4-6.5 km/s; felsic granulites (middle crust) Vp~6.4-6.8 km/s; mafic granulites (lower crust) Vp~6.8-7.2 km/s; pyroxenites and eclogite (lowermost crust) 7.2-7.6 km/s; spinel lherzolites and harzburgites (lithospheric mantle) Vp>7.8 km/s. For data sources see Pavlenkova (1996), Artemieva et al. (2006), Ziegler and Desez (2006), Artemieva (2007), Kelly et al. (2007), Artemieva and Thybo (2011). Lower plots (b, d) show variations in mean P wave velocity in the basement of the European crust (i.e. the crust without the sediments) based on seismic data. Dashed lines refer to in situ conditions (as sampled by seismic methods) and reflect variations in both crustal composition and average crustal temperatures. Solid lines - Vp variations corrected for lateral temperature variations in the crust (based on Artemieva, 2003; 2006), which reflect variations in the average crustal composition and anisotropy (in case it is present). Zero corresponds to average in situ Vp=6.6 km/s in a region with a platform geotherm (surface heat flow ~55 mW/m2). TESZ= Trans-European Suture Zone; DDR= Dnieper-Donets paleorift; NGB= North German basin. (e) P-wave seismic velocity structure of the European Variscides and Caledonides (North German Basin) along the profile DEKORP/ BASIN9601. Seismic velocities are derived from wide-angle seismic data and shown in relation to the line drawing of the seismic reflection data (based on Bayer et al., 1999). |
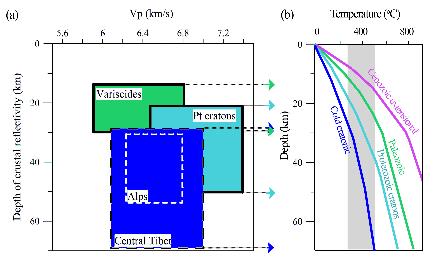
(a) Seismic lamellae in the lower crust in various tectonic provinces where normal incidence and wide-angle observations are available (based oncompilation of Meissner et al., 2006). Four boxes refer to different tectonic settings:
(b) Typical temperatures in the lithosphere of different continental tectonic structures (based on Artemieva and Mooney, 2001). Colors match the corresponding structures in plot (a). Cold lithospheric temperatures in the Tibet and the Alps are associated with subducting lithospheric slabs. Gray shading approximately marks the depths where seismic reflectivity is observed. As the plot illustrates, seismic reflectivity is commonly restricted to a depth with temperatures between 300 and 500 oC |
| Professor Irina M. Artemieva Geology Section, IGN University of Copenhagen Øster Voldgade 10 Copenhagen DK-1350 Denmark Email: iartemieva@gmail.com |

